The correction is integrated into the TP (See the green boxes)
What you will learn in this TP
- Install Docker
- Enable Docker SWARM mode
- Create a Dockerfile
- Modify and/or override an existing docker compose file
- Create a docker compose file from a requirement
- Deploy a docker compose file
- Create a docker stack/service with a docker compose file
- Monitor the infrastructure with Prometheus/Grafana
- Deploy a private registry with Harbor
Introduction #
What you will learn in this sectionThis project aims to have you manipulate different concepts around Docker and especially combine them to achieve a goal. To do this, we will install and configure a Docker cluster with SWARM enabled and deploy various sub-projects on it as a stack. The goal is to set up this architecture:
- Install Docker
- Enable Docker SWARM mode
- Create a Dockerfile
- Modify and/or override an existing docker compose file
- Create a docker compose file from a requirement
- Deploy a docker compose file
- Create a docker stack/service with a docker compose file
- Monitor the infrastructure with Prometheus/Grafana
- Deploy a private registry with Harbor
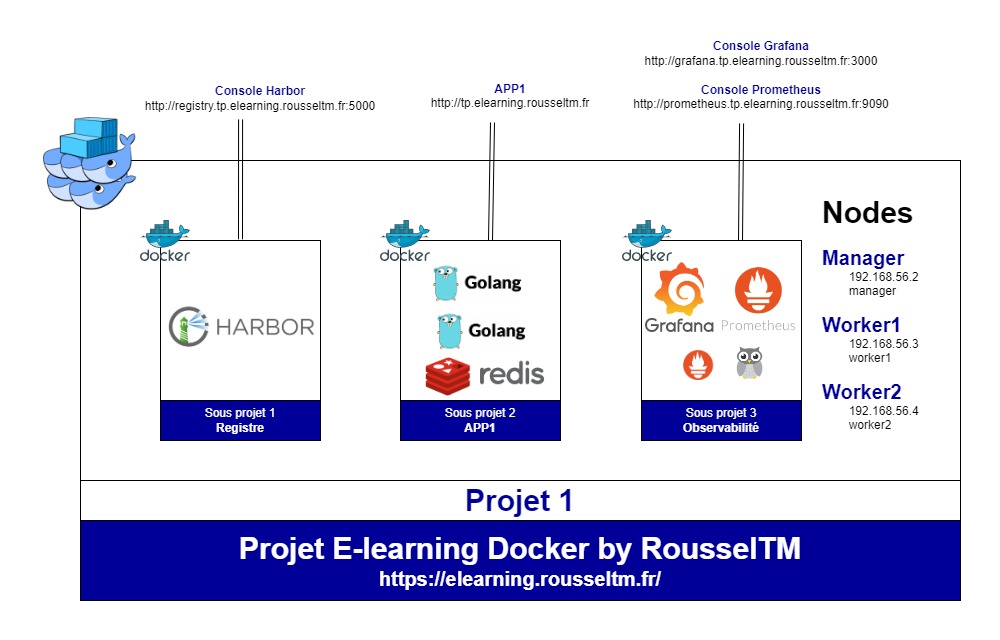 A recommended hardware configuration is 16GB of RAM
Test environment #
To complete this lab, you will need an Ubuntu environment (But the lab can be done with other OS/distributions). On this machine, we will create 3 virtual machines with the following characteristics:- Virtual machine 1:
- Name: manager
- vCPU: minimum 2
- RAM: minimum 2 GB
- IP: 192.168.56.2
- Virtual machine 2:
- Name: worker1
- vCPU: minimum 2
- RAM: minimum 2 GB
- IP: 192.168.56.3
- Virtual machine 3:
- Name: worker2
- vCPU: minimum 2
- RAM: minimum 2 GB
- IP: 192.168.56.4
REMINDER: This lab is dedicated to Docker configuration, but since it is an advanced lab, you will need concepts and knowledge around DevOps that are not specific to Docker but will be used in your configurations. You will need the following skills, which you can train for free:Of course, we will provide as much information as possible to help you progress even without these prerequisites.
- Vagrant: View training
- Traefik: View training
- Prometheus: View training
- Grafana: View training
- DevOps: View training
For this, you must install Vagrant and Virtualbox on your machine. Once done, you just have to run the following commands:
git clone https://github.com/RousselTM/docker-formation
cd docker-formation/tp/6_projet
vagrant up
Pre-configuration #
The following actions are necessary to prepare your test environment.
Domains
You must declare the following domains on your machine (in the hosts file). They will be used to access the different sub-projects and must point to 127.0.0.1 (In the next lab we will introduce Traefik to optimize port management):- tp.elearning.rousseltm.fr: To access the applications. For example, to access application 1, we will use the address http://tp.elearning.rousseltm.fr/app1
- registry.tp.elearning.rousseltm.fr: to access Harbor
- grafana.tp.elearning.rousseltm.fr: to access Grafana
- prometheus.tp.elearning.rousseltm.fr: to access Prometheus
You must add this information in the hosts file. The path to access the file will vary depending on your host OS:
- /etc/hosts: Linux
- C:\Windows\System32\drivers\etc: Windows
Docker Installation
You can check if your machines have started correctly with the following command:
If they have started correctly (status running), you can connect to the manager machine with the following command:vagrant status
You just need to install Docker on all VMs. Once the installation is done, you must start the service and set it to start automatically.vagrant ssh managerFind all the Docker installation procedures on this page Docker Installation.
For our lab, we will follow the procedure for the Ubuntu OS. You should favor procedures based on the package manager: apt, dnf, yum.
You can ask Vagrant to do the installation automatically:
You just need to set the environment variable ROUSSELTM_DEPLOY_DOCKER to 'true' when creating the machines, and the Vagrant configuration will install Docker
You must run the following commands to respectively start and enable automatic startup of DockerROUSSELTM_DEPLOY_DOCKER=true vagrant up
Vagrant can also automatically configure your Docker SWARM cluster:sudo systemctl start docker sudo systemctl enable docker
Of course, in an enterprise environment, you should rather use your configuration as code solution (Ansible, Salt project, ...).ROUSSELTM_DEPLOY_SWARM=true vagrant upSWARM Mode
You must set up the Docker cluster with SWARM mode enabled. The 'manager' machine must be the cluster manager, and the 'workerX' machines must be the cluster workers. Since the machines have multiple IPs, we will use the IP 192.168.56.2 as the control plane management address.REMINDER: On all machines created by Vagrant there is a /vagrant folder which corresponds to the mount of the folder where the Vagrantfile is located: so the 6_projet folder content. So you can use this folder to share files between machines. For example, the file containing the tokens to join the cluster. Of course, in Production, a more secure solution should be used
You must provide the Docker command that will store the token to join the cluster as a worker in /vagrant/swarm-token-worker.You must initialize swarm mode on a machine intended to be a manager, so in our case on the 'manager' machine with the following command:
You can also use the network card name instead of the IP (recommended method).docker swarm init --advertise-addr 192.168.56.2 --listen-addr 192.168.56.2
To generate and share the token that will be used on the worker nodes:
On the worker nodes, you can make them join with the following command:docker swarm join-token -q worker > /vagrant/swarm-token-workerdocker swarm join --advertise-addr 192.168.56.2 --listen-addr 192.168.56.2 --token `cat /vagrant/swarm-token-worker` 192.168.56.2:2377Shared network
You must create the following networks- common-proxy: for communication between containers via the proxy. Will be fully used in the next lab with the use of Traefik.
- common-observability: for communication between observability containers
On a machine with the manager status (in our case it's the machine named manager), you can do it with the following commands:
Using the overlay driver automatically enables the SWARM 'scope'.docker network create --driver overlay --attachable common-proxy docker network create --driver overlay common-observability
Sub-project 1 #
We will create a Docker registry with Harbor on the manager machine. We will run it on the domain registry.tp.elearning.rousseltm.fr. For this first project, we will deploy it in HTTP on port 5000 (default port for Docker registries in HTTP).REMINDER: The official Harbor website is https://goharbor.io/ and you can review the Harbor presentation video at this address: Harbor Presentation and Deployment
Deployment
You must install Harbor with the trivy service on port 5000. If everything is ok, you should be able to access Harbor from the host machine at the addresshttp://registry.tp.elearning.rousseltm.fr:5000INFORMATION: In the 6_projet folder, you have a folder named 'projects' whose content will be automatically mounted in /opt/projects on all VMs. You can therefore use it to manage your files for the sub-projects. We recommend 1 folder per sub-project.
You must follow the procedure described on the Harbor website to download and install it
https://goharbor.io/docs/2.11.0/install-config/download-installer/Customization
The install.sh script generated a docker-compose.yml file, so if we want to modify parameters we must edit this file. But we will lose all our modifications with each execution of the script.
You must propose a solution to avoid this, knowing that we want the 'proxy' container to connect to the 'common-proxy' network and that it has the dt.owner label (Explanation of this Dynatrace label) with the value 'equipe1'. At the same time, add a label to tell Filebeat not to take its logs into account.
We will initially simply deploy with 'docker compose' to test, and secondly as a stack with 'docker stack'.ATTENTION: The override must also be taken into account by the install.sh script
Since the script does not have an -f option to pass an override file, we must use the default override file
with the following contentcompose.override.yml
Sub-project 2 #
Image build
You must create a Dockerfile to build an image for the following GO application which will be named simple-app and will have the tag 1.0:Adding the image to the Harbor registry
You must send this image to the 'library' project (Explanation of the project concept in Harbor) in Harbor. We chose 'library' because it is the default Public project. Thus, the image can be used in other projects (See next lab). As a reminder, following your installation, Harbor is available at the addresshttp://registry.tp.elearning.rousseltm.fr:5000Since our registry is in HTTP, we must instruct docker to make an HTTP connection instead of HTTPS by default. We must therefore add this configuration to the '/etc/docker/daemon.json' file:
Here are the commands to send the image to the private registry{ ... "insecure-registries" : ["registry.tp.elearning.rousseltm.fr:5000"], ... }docker login registry.tp.elearning.rousseltm.fr:5000 docker tag simple-app:1.0 registry.tp.elearning.rousseltm.fr:5000/library/simple-app:1.0 docker push registry.tp.elearning.rousseltm.fr:5000/library/simple-app:1.0Vulnerability scan
You must scan the imported image to check its vulnerabilities against CVE flaws.
In the Harbor console (http://registry.tp.elearning.rousseltm.fr:5000), you must follow these steps:
- Click on the 'Projects' menu on the left (open by default upon logging into Harbor)
- Click on the project. In our case 'library'
- Click on the image. In our case 'library/simple-app'
- Select the image tags (artifacts) to scan. In our case the one with the tag '1.0'
- Click the 'SCAN VULNERABILITY' button
Docker deployment
The configuration to build must meet these needs:- 2-tier application: go and redis
- The services must only run on the workers. This configuration must be externalized to allow sharing it with other applications in the same case.
- The services must use the latest versions (in production use fixed versions) of the official images and the GO application must use the image built previously and available on Harbor.
- 1 instance of each service
- The GO service must export the environment variable APP='APP1'
- The GO service must export the TASK_SLOT environment variable in which you must put the replica number of the container (Templates).
- The GO application service must be attached to the 'common-proxy' network
Here is an example of the docker compose file content
Load balancing
You must verify that when you call the application's URL (http://tp.elearning.rousseltm.fr) it correctly returns this page and that the highlighted fields change properly when you refresh the page and properly switch between the two containers: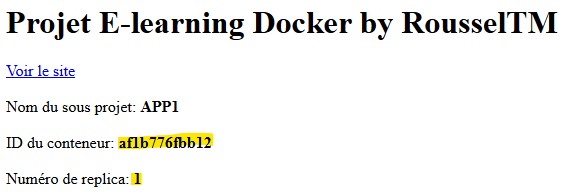
Since this is an HTTP URL, it is possible that your browser automatically redirects to HTTPS. You can disable this browser option, but we recommend using its 'private browsing' mode instead (you must reopen the page to see the load balancing). You can also verify this in the command line with the curl command:
curl http://tp.elearning.rousseltm.fr/
Sub-project 3 #
Observability sub-project consisting of Prometheus, Grafana, Node exporter, and cAdvisor. This sub-project is the observability one and will thus allow us to have visibility over our entire project.
Docker deployment
The configuration to build must meet these needs:- Make Grafana accessible on port 3000
- Make Prometheus accessible on port 9090
You can refer to the commands from sub-project 2 for everything related to execution commands. If everything is OK, your configuration should look like this configuration:
Services configuration
The configuration to build must meet these needs:- Automatically import the Prometheus and Elasticsearch datasources into Grafana
- Import the dashboards with ID: 609
- Collect Traefik metrics
- Collect metrics from all nodes in the cluster
- Collect metrics from all containers
As indicated in the compose.yaml file, we need:
- A config/grafana/provisioning/datasources/datasource.yml file: here is an example content
- A config/prometheus/prometheus.yml file: here is an example content
Difficulty level : ●●●○○ (3/5)
Course Glossary
DevOps
A culture, movement, and set of practices designed to unify software development (Dev) and IT operations (Ops).
API Gateway
A gateway that acts as a single entry point for all requests to a microservices architecture. It handles routing, security, and rate limiting.
Architecture
The overall structural design of an IT system, defining its various components, their relationships, and the principles guiding its evolution.
Artifact
The final outcome of a software compilation or build process, such as a .jar file, a zip archive, or a Docker image, ready for deployment.
Repository
A centralized storage location. This can refer to a source code repository (e.g., Git) or an artifact and binary repository (e.g., Harbor, Nexus, Arti...
Docker
An open-source platform designed to make it easier to create, deploy, and run applications by isolating them into portable, lightweight software conta...