[TP] Filebeat Installation
What you will learn in this TP :
- Install Filebeat
- Identify important files and directories
- Use modules
- Advanced use of labels
- Deploy a Harbor registry
- Import an image into a registry
- Scan an image for vulnerabilities
- Set up the override of a docker compose file
- Advanced use of labels (Implemented in Project 2)
Introduction
What you will learn in this section :We will proceed with the installation of Filebeat using Docker technology.
- Install Filebeat
- Identify important files and directories
- Use modules
- Advanced use of labels
-
Procedure
You must provide the link to find all Filebeat installation procedures as well as the one to install it on a Linux type OS.
Docker
We will proceed with the installation of Filebeat on Docker with a docker compose file.-
Folders
You must provide the list of folders necessary for Filebeat to work properly in a Docker environment. -
SWARM Mode
You must set up the Docker cluster with SWARM mode enabled. The 'manager' machine must be the cluster manager and the 'workerX' machines must be the cluster workers. Since the machines have several IPs, we will use the IP 192.168.56.2 as the management address of the control plane.REMINDER: On all machines created by Vagrant there is a /vagrant folder which corresponds to the mount of the folder containing the Vagrantfile: therefore the content of the 6_project folder. So you can use this folder to share files between machines. For example, the file containing the tokens to join the cluster. Obviously, in Production, a more secure solution must be used
You must provide the Docker command that will allow you to store in /vagrant/swarm-token-worker the token to join the cluster as a worker. -
Shared network
You must create the following networks- common-proxy: for communication between containers via the proxy. Will be fully used in the next lab with the use of Traefik.
- common-observability: for communication between observability containers
Subproject 1
What you will learn in this section :We will create a docker registry with Harbor on the manager machine. We will run it on the domain registry.tp.elearning.rousseltm.fr. For this first project, we will deploy it in HTTP on port 5000 (default port for Docker registries in HTTP).
- Deploy a Harbor registry
- Import an image into a registry
- Scan an image for vulnerabilities
- Set up the override of a docker compose file
- Advanced use of labels (Implemented in Project 2)
REMINDER: The official Harbor website https://goharbor.io/ and you can review the Harbor presentation video at this address: Harbor Presentation and Deployment
-
Deployment
You must install Harbor with the trivy service on port 5000. If everything is OK, you should be able to access Harbor from the host machine at the addresshttp://registry.tp.elearning.rousseltm.fr:5000INFORMATION: In the 6_project folder, you have a folder named 'projects' whose content will automatically be mounted in /opt/projects on all VMs. You can therefore use it to manage your files for the subprojects. We recommend 1 folder per subproject.
-
Customization
The install.sh script generated a docker-compose.yml file, so if we want to change parameters we will have to edit this file. But we will lose all our modifications every time the script is executed.
You must propose a solution to prevent this, knowing that we want the 'proxy' container to connect to the 'common-proxy' network and have the dt.owner label (Explanation of this Dynatrace label) with the value 'team1'. At the same time, add a label to tell Filebeat to ignore its logs.
We will first deploy simply with 'docker compose' to test and secondly as a stack with 'docker stack'.WARNING: The override must also be taken into account by the install.sh script
Subproject 2
-
Build image
You must create a Dockerfile to build an image for the following GO application which will be named simple-app and will have the tag 1.0: -
Adding the image to the Harbor registry
You must send this image to the 'library' project (Explanation of the project concept in Harbor) in Harbor. We chose 'library' because it is the default Public project. This way, the image can be used in other projects (See next lab). As a reminder, following your installation, Harbor is available at the addresshttp://registry.tp.elearning.rousseltm.fr:5000 -
Vulnerability scan
You must scan the imported image to check its vulnerabilities against CVE flaws. -
Docker Deployment
The configuration to build must meet these needs:- 2-tier application: go and redis
- Services must only run on workers. This configuration must be externalized to allow it to be shared with other applications in the same case.
- Services must use the latest versions (in production use fixed versions) of official images and the GO application must use the image built previously and available on Harbor.
- 1 instance of each service
- The GO service must export the APP='APP1' environment variable
- The GO service must export the TASK_SLOT environment variable in which you must put the replica number of the container (Templates).
- The go application service must be attached to the 'common-proxy' network
-
Load balancing
You must verify that when you call the application URL (http://tp.elearning.rousseltm.fr) it returns this page and that the highlighted fields change when you refresh the page and properly switch between the two containers: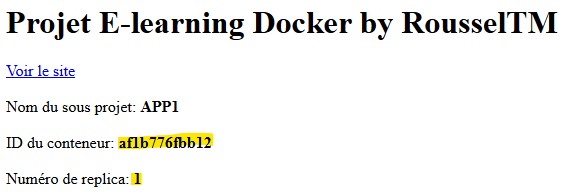
Subproject 3
Observability subproject consisting of Prometheus, Grafana, Node exporter and cAdvisor. This subproject is for observability and therefore will allow us to have visibility over our entire project.-
Docker Deployment
The configuration to build must meet these needs:- Make Grafana accessible on port 3000
- Make Prometheus accessible on port 9090
-
Service configuration
The configuration to build must meet these needs:- Automatically import Prometheus and Elasticsearch datasources into Grafana
- Import dashboards with ID: 609
- Collect Traefik metrics
- Collect metrics from all cluster nodes
- Collect metrics from all containers
Recommended Articles
Understand the evolution of billing in Dynatrace: the difference between the ...
Discover why and how to configure Grafana Alloy so that it monitors itself, c...
Discover how to enable, secure, and use Grafana Alloy's built-in web interfac...
Discover the fundamental concepts of Grafana Alloy, the transition from the s...
As part of a Grafana training or observability training, master the declarati...
Learn how to configure Grafana Alloy to collect, transform, and forward metri...
Discover how to configure Grafana Alloy to read log files, journald, or netwo...
Dive into distributed trace processing. Learn how to ingest OTLP, Jaeger, or ...
Discover how to configure continuous profiling in your environments using Gra...
Learn how to manage large-scale Grafana Alloy deployments. Configure Clusteri...
Discover Grafana Assistant, the artificial intelligence integrated into Grafa...
Comparison between Grafana Alloy and Dynatrace ActiveGate. Understand the fun...
Course Glossary
A data collection program installed on a host system, designed to consume minimal resources (CPU, RAM). Example: Filebeat, Promtail.
A collection program equipped with extensive local features (processing, filtering, buffering) that consumes more system resources. Example: Logstash.
Lightweight data shippers (like Filebeat, Metricbeat, etc.) installed on servers to collect and send various types of operational data (logs, metrics)...