1. Discovery #
Auto-detection of targets via Kubernetes, Consul, or static files.
Finding targets automatically #
Available in: ✓ OSS ✓ Enterprise ✓ Cloud
In a modern environment, targets appear and disappear without warning. Rather than listing addresses, this task goes to the discovery.* components, which publish a list of targets in targets.
| Component | Source |
|---|---|
discovery.kubernetes | Pods, services, nodes… through the Kubernetes API |
discovery.docker | Docker daemon containers |
discovery.file | JSON or YAML files maintained by another tool |
discovery.http | An API returning targets |
discovery.dns | DNS records |
discovery.process | Processes of the machine |
What is a target? #
A target is a simple object of labels. __address__ gives the address. Labels starting with __ are internal: they serve relabeling, then disappear before storage. You can read them in the UI, on the component page.
Example with a file #
A team describes its targets in a file, without touching the Alloy configuration:
[
  {
    "targets": ["app-1:8080", "app-2:8080"],
    "labels": { "equipe": "plateforme", "env": "prod" }
  }
]
discovery.file "applis" {
files = ["/etc/alloy/cibles/*.json"]
refresh_interval = "30s"
}
discovery.relabel "applis" {
targets = discovery.file.applis.targets
rule {
source_labels = ["env"]
regex = "dev"
action = "drop"
}
rule {
target_label = "cluster"
replacement = "paris"
}
}Result observed in the Alloy UI, for each target: __address__, env=lab, equipe=plateforme and cluster=paris. dev targets are discarded.
action = "drop"discards what matches,"keep"keeps only that. A rule with noactionreplaces: it writesreplacementtotarget_label.
Example on Kubernetes #
We keep only annotated pods and turn internal metadata into lasting labels:
discovery.kubernetes "pods" {
  role = "pod"
}

discovery.relabel "annotes" {
  targets = discovery.kubernetes.pods.targets

  rule {
    source_labels = ["__meta_kubernetes_pod_annotation_prometheus_io_scrape"]
    regex         = "true"
    action        = "keep"
  }

  rule {
    source_labels = ["__meta_kubernetes_namespace"]
    target_label  = "namespace"
  }

  rule {
    source_labels = ["__meta_kubernetes_pod_name"]
    target_label  = "pod"
  }
}
Pitfall: without an explicit rule,__meta_*labels disappear. If you wantnamespaceandpodin your metrics, you must copy them, as above.
2. Scraping #
Configuration of the prometheus.scrape component.
The prometheus.scrape component #
prometheus.scrape regularly queries each target and passes metrics to the rest of the pipeline. It works like Prometheus, but stores nothing.
prometheus.scrape "applis" {
  targets         = discovery.relabel.applis.output
  scrape_interval = "30s"
  scrape_timeout  = "10s"
  metrics_path    = "/metrics"
  forward_to      = [prometheus.relabel.filtre.receiver]
}

discovery.relabel "applis" {
  targets = []
}

prometheus.relabel "filtre" {
  rule {
    source_labels = ["__name__"]
    regex         = "go_gc_.*"
    action        = "drop"
  }
  forward_to = [prometheus.remote_write.mimir.receiver]
}

prometheus.remote_write "mimir" {
  endpoint {
    url = "http://mimir:9009/api/v1/push"
  }
}| Argument | Purpose | Default |
|---|---|---|
scrape_interval | Scrape frequency | 60s |
scrape_timeout | Maximum time | 10s |
metrics_path | Metrics path | /metrics |
job_name | Value of the job label | Component name |
honor_labels | Keep target labels on conflict | false |
Mind the default: 60 seconds, against 15 in many Prometheus configurations. If your charts look less precise after a migration, check this setting first.
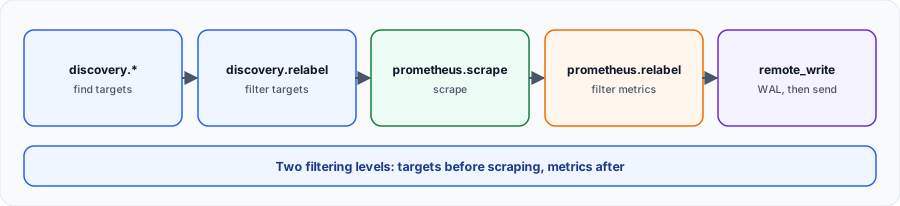
Two filtering levels #
| Component | Acts on | When | Example |
|---|---|---|---|
discovery.relabel | Targets | Before scraping | Ignore dev pods |
prometheus.relabel | Metrics | After scraping | Remove go_gc_.* |
Not scraping a target saves far more than filtering its metrics afterwards: filter as early as possible.
Collecting the system without node_exporter #
Alloy embeds exporters. prometheus.exporter.unix replaces node_exporter, and publishes its targets like any discovery component:
prometheus.exporter.unix "hote" {
  enable_collectors = ["cpu", "meminfo", "diskstats", "filesystem", "netdev"]
}

prometheus.scrape "hote" {
  targets    = prometheus.exporter.unix.hote.targets
  forward_to = [prometheus.remote_write.mimir.receiver]
}

prometheus.remote_write "mimir" {
  endpoint {
    url = "http://mimir:9009/api/v1/push"
  }
}
Checking collection #
In the UI, the prometheus.scrape page shows each target's URL, state (up or down) and last error. The prometheus_scrape_targets_gauge metric counts targets. A down target does not stop the component from being healthy: also watch the up series.
3. Remote Write #
Forwarding data to Grafana Cloud or a local instance.
Sending to Mimir, Prometheus or Grafana Cloud #
prometheus.remote_write sends metrics to any compatible backend. It first writes to an on-disk log (WAL), then ships from that log: a backend outage therefore does not lose data immediately.
prometheus.remote_write "mimir" {
  external_labels = { region = "eu-west" }

  endpoint {
    url = "https://mimir.example.com/api/v1/push"

    basic_auth {
      username = sys.env("MIMIR_USER")
      password = sys.env("MIMIR_PASSWORD")
    }

    queue_config {
      capacity             = 10000
      max_shards           = 10
      max_samples_per_send = 2000
    }

    write_relabel_config {
      source_labels = ["__name__"]
      regex         = "up|node_.*"
      action        = "keep"
    }
  }

  wal {
    truncate_frequency = "2h"
    max_keepalive_time = "8h"
  }
}
Useful settings #
| Setting | Purpose | Default |
|---|---|---|
external_labels | Labels added to everything sent | – |
queue_config.capacity | Samples buffered per shard | 10000 |
queue_config.max_shards | Maximum concurrent sends | 50 |
queue_config.max_samples_per_send | Size of one send | 2000 |
wal.truncate_frequency | WAL cleanup frequency | 2h |
wal.max_keepalive_time | Maximum retention when sending fails | 8h |
During an outage: data is kept about 8 hours by default, and the disk grows meanwhile. Plan space for --storage.path.Filtering per destination #
write_relabel_config filters for one backend only. We measured it by sending the same data to two destinations: the one keeping only up and alloy_build_info received 8 samples, the other 1765. This is the simplest way to reduce a storage bill.
Monitoring sending #
# Samples failing to send (alert on this)
rate(prometheus_remote_storage_samples_failed_total[5m]) > 0

# Queue towards the backend
prometheus_remote_storage_samples_pending

# Scraped targets
prometheus_scrape_targets_gauge
Best practice: keep passwords in the environment or a file (see Secrets Management), and make --storage.path persistent: otherwise the WAL disappears when the container restarts.4. OTLP Interoperability #
Receiving and transforming OpenTelemetry metrics.
The bridge between Prometheus and OTLP #
Alloy shines in its ability to unify ecosystems. With the otelcol components, Alloy can act as an OpenTelemetry collector, receiving metrics in OTLP format sent directly by your instrumented applications, converting them on the fly, and integrating them into your existing Prometheus export pipeline.
2026 update: what has changed #
Recent changes worth knowing (checked in November 2026).
Alloy and Prometheus 3 #
Grafana Alloy ships a minor release roughly every three weeks; 1.21 (October 2026) is the latest at the time of this update. Read the release notes before each upgrade: some releases bring a new Prometheus or OpenTelemetry Collector branch, with flagged breaking changes.
- Recent Alloy releases embed Prometheus 3 (Alloy 1.18 moved to Prometheus 3.12): UTF-8 metric names and left-open query windows also apply to rules evaluated by Alloy.
- Native histograms, stable in Prometheus 3.8, can be collected and forwarded through remote write: check that your backend (Mimir, Prometheus, Grafana Cloud) accepts them.
- For new OpenTelemetry instrumentation, rather send OTLP to Alloy and let
otelcol.exporter.prometheusdo the conversion.
