1. Why recording rules? #
Compute in advance rather than on every read.
The problem #
A PromQL query is computed when it runs. On a twenty-panel dashboard, refreshed every thirty seconds and opened by ten people, Prometheus keeps repeating the same computations on the same samples. The dashboard gets slow, and every extra user makes it worse.
A recording rule solves this: Prometheus evaluates the expression at a regular interval and writes the result to a new series. Reads become simple accesses to that series.
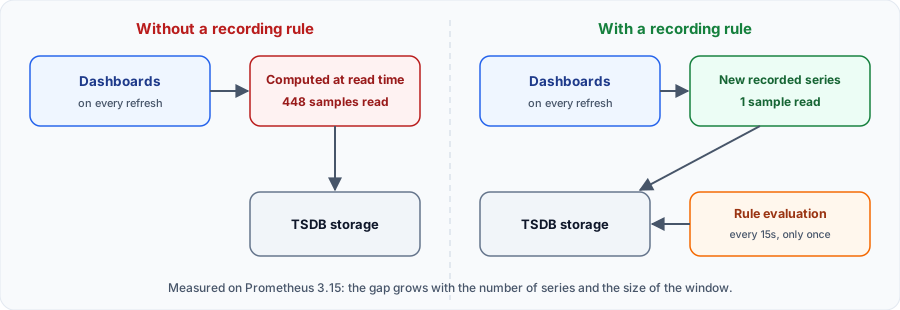
Real measurement: on a test Prometheus 3.15, withstats=all,sum by (job) (rate(prometheus_http_requests_total[5m]))reads 448 samples, and the equivalent recorded series just one. The gap is far larger on a production server.
When to use them, and when not to #
| Good idea | Bad idea |
|---|---|
| Expensive, frequent query (heavily used dashboard) | Query run rarely, by hand |
| Alert with a heavy expression | Query already fast on few series |
| Shared indicator (SLI, error rate) defined only once | Keeping all original labels: nothing is reduced |
| Aggregates to keep for a long time or to federate | Replacing exploration: the window (5m) is fixed |
A rule is not free: each recorded series uses storage and memory, like a scraped series. The gain comes from aggregation: replacing thousands of series with a few dozen.
2. How Prometheus evaluates them #
Groups, interval, order and no retroactive effect.
How it works #
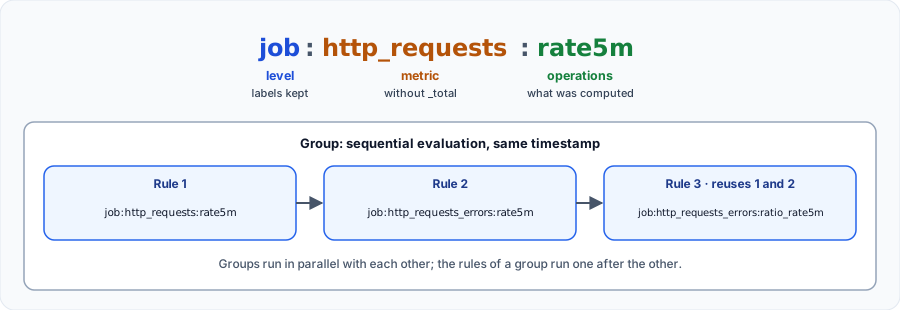
- Rules live in groups, declared in files referenced by
rule_files. - Within a group they run in order, at the same timestamp. A rule can therefore use the result of the previous one.
- The interval is the group's (
interval), otherwise the globalevaluation_interval. - The result keeps the labels of the expression; the metric name is replaced by
record. - A rule only computes the present: a new rule has no history, unless recomputed manually (see below).
Mind the interval: a series with no point for more than five minutes (the default lookback) no longer appears in instant queries. A group evaluated every ten minutes therefore produces gaps.
3. Writing your first rules #
The syntax, a full example and group options.
A rules file #
Declare the file in prometheus.yml, then write the rules. These examples use Prometheus's own metrics, so you can try them straight away:
global:
  scrape_interval: 5s
  evaluation_interval: 15s

rule_files:
  - /etc/prometheus/rules.yml

scrape_configs:
  - job_name: prometheus
    static_configs:
      - targets: ["localhost:9090"]
groups:
- name: http_prometheus
rules:
- record: job_handler:prometheus_http_requests:rate5m
expr: sum by (job, handler) (rate(prometheus_http_requests_total[5m]))
- record: job:prometheus_http_requests:rate5m
expr: sum by (job) (job_handler:prometheus_http_requests:rate5m)
- record: job:prometheus_http_requests_errors:rate5m
expr: sum by (job) (rate(prometheus_http_requests_total{code=~"5.."}[5m]))
- record: job:prometheus_http_requests_errors:ratio_rate5m
expr: |
(job:prometheus_http_requests_errors:rate5m or job:prometheus_http_requests:rate5m * 0)
/ job:prometheus_http_requests:rate5m
- record: job:prometheus_http_request_duration_seconds:p95_rate5m
expr: |
histogram_quantile(0.95,
sum by (job, le) (rate(prometheus_http_request_duration_seconds_bucket[5m])))In Grafana, the query becomes very simple:
# Before: recomputed on every refresh of every panel
sum by (job) (rate(http_requests_total[5m]))

# After: simple read of the recorded series
job:http_requests:rate5m
Group options #
groups:
  - name: http_aggregates
    interval: 30s        # otherwise: the global evaluation_interval
    query_offset: 30s    # evaluates slightly in the past if data arrives late
    limit: 1000          # the rule fails if it produces more than 1000 series
    labels:
      team: platform     # added to all rules of the group
    rules:
      - record: job:http_requests:rate5m
        expr: sum by (job) (rate(http_requests_total[5m]))
4. Naming your rules well #
The level:metric:operations convention.
The official convention #
The Prometheus documentation recommends the level:metric:operations format. The name then says what the series contains, without opening the rules file. Colons are reserved for this purpose: exporters must not use them.
| Part | Meaning | Example |
|---|---|---|
| level | Labels kept by the aggregation | job, instance_path |
| metric | Original name, without the _total suffix after a rate | http_requests |
| operations | Applied operations, newest first | rate5m, ratio_rate5m, p95_rate5m |
5. Pitfalls to avoid #
Ratios, missing series, order of operations.
Never average ratios #
A service at 10 requests per second with 50% errors and another at 1000 requests per second with 0% do not average 25% errors, but about 0.5%. So record the numerator and denominator, then divide their sums:
# Wrong: average of ratios, a small service weighs as much as a big one
avg by (job) (instance:http_requests_errors:ratio_rate5m)

# Right: aggregate the numerator and denominator separately
sum by (job) (instance:http_requests_errors:rate5m)
  / sum by (job) (instance:http_requests:rate5m)
The ratio that disappears when all is well #
This is the sneakiest pitfall, observed while preparing this chapter. If no 5xx series exists, the filter returns nothing, and dividing by an empty result gives an empty result, not 0. The dashboard shows “No data”: you can then no longer tell “no errors” from a collection outage.
# Empty as long as no 5xx error has been seen
job:requests_errors:rate5m / job:requests:rate5m

# Equals 0 when there is no error
(job:requests_errors:rate5m or job:requests:rate5m * 0) / job:requests:rate5m
Other frequent mistakes #
ratefirst,sumsecond:sum(rate(x[5m])). Adding counters beforeratebreaks the detection of their resets.- Histograms: keep the
lelabel insum by, orhistogram_quantilecannot compute anything. - Too many labels: a rule keeping
instanceorpodkeeps almost all the cardinality. - Changing a rule: if the expression changes meaning, change the name too, or the old and new logic mix in the same series.
6. Testing rules with promtool #
Checks and unit tests, before deploying.
Unit tests, with no server #
promtool check rules checks the syntax. promtool test rules goes further: it injects fake series, evaluates the rules and compares the result. The test below covers both cases of the previous pitfall:
rule_files:
  - rules.yml
evaluation_interval: 1m

tests:
  - name: 10% errors
    interval: 1m
    input_series:
      - series: 'prometheus_http_requests_total{job="api",handler="/a",code="200"}'
        values: '0+54x10'
      - series: 'prometheus_http_requests_total{job="api",handler="/a",code="500"}'
        values: '0+6x10'
    promql_expr_test:
      - expr: job:prometheus_http_requests:rate5m
        eval_time: 10m
        exp_samples:
          - labels: 'job:prometheus_http_requests:rate5m{job="api"}'
            value: 1
      - expr: job:prometheus_http_requests_errors:ratio_rate5m
        eval_time: 10m
        exp_samples:
          - labels: 'job:prometheus_http_requests_errors:ratio_rate5m{job="api"}'
            value: 0.1

  - name: no errors, the ratio is 0 and not empty
    interval: 1m
    input_series:
      - series: 'prometheus_http_requests_total{job="api",handler="/a",code="200"}'
        values: '0+60x10'
    promql_expr_test:
      - expr: job:prometheus_http_requests_errors:ratio_rate5m
        eval_time: 10m
        exp_samples:
          - labels: 'job:prometheus_http_requests_errors:ratio_rate5m{job="api"}'
            value: 0
How to read values: '0+54x10': the series starts at 0 and grows by 54 at each of the 10 one-minute steps, that is 0.9 requests per second. With 0.1 failing requests, the expected ratio is indeed 0.1.
7. Deploying #
Reloading the configuration, Kubernetes.
Reloading without a restart #
After a change, send SIGHUP to the process, or call POST /-/reload if Prometheus runs with --web.enable-lifecycle. An error in the file leaves the old configuration in place, so check the result in Status > Rule health or with /api/v1/rules.
--web.enable-lifecycle lets anyone reaching the port reload or stop Prometheus. Protect this access in production.On Kubernetes #
With the Prometheus Operator, rules are declared by a PrometheusRule resource. Its label must match your Prometheus ruleSelector, or it is silently ignored.
apiVersion: monitoring.coreos.com/v1
kind: PrometheusRule
metadata:
  name: http-recording-rules
  namespace: monitoring
  labels:
    release: kube-prometheus-stack   # must match the ruleSelector of your Prometheus
spec:
  groups:
    - name: http
      rules:
        - record: job:http_requests:rate5m
          expr: sum by (job) (rate(http_requests_total[5m]))
8. Monitoring your rules #
Detecting a slow group or a failing rule.
Metrics to watch #
If a group takes longer to evaluate than its interval, evaluations are skipped and gaps appear. Prometheus exposes everything needed to detect it:
# Does an evaluation exceed its interval? (watch this first)
rate(prometheus_rule_group_iterations_missed_total[5m]) > 0

# Share of the interval used by each group
prometheus_rule_group_last_duration_seconds / prometheus_rule_group_interval_seconds

# Failing rules
rate(prometheus_rule_evaluation_failures_total[5m]) > 0
Best practice: alert on prometheus_rule_group_iterations_missed_total. If a group becomes too slow, split it: groups run in parallel.9. Recomputing the past #
Backfilling with promtool.
Creating a history for a new rule #
promtool tsdb create-blocks-from rules queries a Prometheus API and writes TSDB blocks to the data/ folder (--output-dir option). They must then be moved to the data directory (storage.tsdb.path): they merge with existing blocks at the next compaction.
Documented limits: a rule depending on another rule being backfilled is not supported: backfill the base rules first, move their blocks, then run again for the dependent rules. Alerts in the file are ignored. Running again over an overlapping period creates blocks with the same data each time.
Commands to know #
# Check the syntax and count the rules
promtool check rules rules.yml

# Run the unit tests
promtool test rules tests.yml

# Reload without restarting (with --web.enable-lifecycle)
curl -X POST http://localhost:9090/-/reload

# List rules, their health and duration
curl -s http://localhost:9090/api/v1/rules | jq '.data.groups[] | {name, evaluationTime, rules: [.rules[] | {name, health}]}'

# Measure the cost of a query
curl -s --get --data-urlencode 'query=job:prometheus_http_requests:rate5m' --data-urlencode 'stats=all' \
  http://localhost:9090/api/v1/query | jq .data.stats.samples.totalQueryableSamples

# Recompute the past (creating TSDB blocks)
promtool tsdb create-blocks-from rules --start 2026-11-01T00:00:00Z --end 2026-11-02T00:00:00Z \
  --url http://localhost:9090 --eval-interval 60s rules.yml