1. What is Elastic Agent? #
One agent for all collection.
The principle #
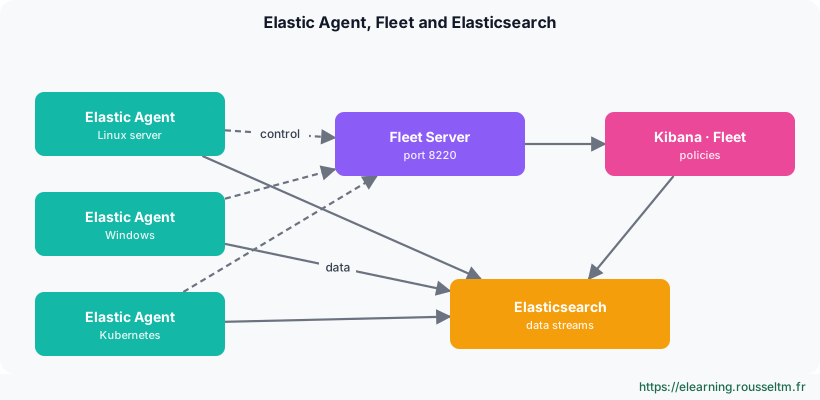
Elastic Agent is Elastic's single agent for collecting logs, metrics, security data and OpenTelemetry telemetry on a host, container or cluster. It replaces installing several Beats (Filebeat, Metricbeat, Winlogbeat…) with one process, configured by a policy listing the integrations to run.
Good to know: Elastic Agent is free and part of Elastic's default distribution; some integrations (Elastic Defend, advanced security connectors) depend on your subscription.
What runs in an agent #
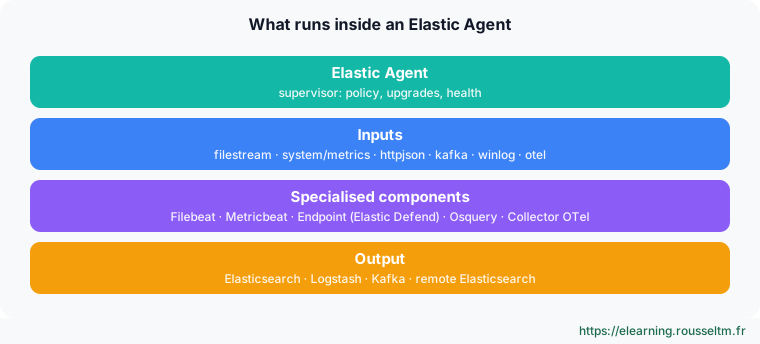
The agent is a supervisor: it receives the policy, starts the required components (derived from Beats, Endpoint for Elastic Defend, Osquery, OpenTelemetry Collector), monitors their health and handles upgrades.
2. Fleet, Fleet Server and policies #
Managing thousands of agents from Kibana.
The roles #
| Component | Role |
|---|---|
| Fleet | Kibana app: policies, integrations, enrollment, upgrades, agent status |
| Fleet Server | Component (a special Elastic Agent) that distributes policies and collects agent status; port 8220 by default |
| Agent policy | Set of integrations and settings applied to a group of agents (e.g. « prod web servers ») |
| Integration | Versioned package: collection config, ingest pipelines, mappings, Kibana dashboards |
| Elastic Package Registry | Integration catalogue (public or self-hosted for air-gapped sites) |
Managed or standalone mode #
| Fleet-managed | Standalone | |
|---|---|---|
| Configuration | Policy in Kibana | elastic-agent.yml file |
| Upgrades | From Fleet, in batches | With your tools (Ansible, image) |
| Prerequisites | Fleet Server | None: direct shipping to Elasticsearch |
| Typical use | Server fleets, many teams | GitOps, ephemeral containers, isolated sites |
Good practice: Start in managed mode to discover integrations, then export the policy as YAML if you want to version it in standalone mode.
3. Where does data go? #
Data streams and outputs.
Data streams #
Each integration writes to data streams named type-dataset-namespace: logs-nginx.access-default, metrics-system.cpu-prod. The namespace, chosen in the policy, separates environments or teams and drives access rights.
GET _data_stream/logs-nginx.access-*
GET logs-nginx.access-default/_search?size=1
Outputs #
- Elasticsearch: default, direct.
- Logstash: heavy transformations, routing, buffering.
- Kafka: decoupling and large-scale buffering.
- Remote Elasticsearch: ship to a cluster other than Fleet's.
Common mistake: Mixing up the Fleet Server URL (control, port 8220) and the Elasticsearch URL (data, port 9200 or 443): the agent enrolls but sends no data.
