1. Architecture #
One agent per node.
The DaemonSet #
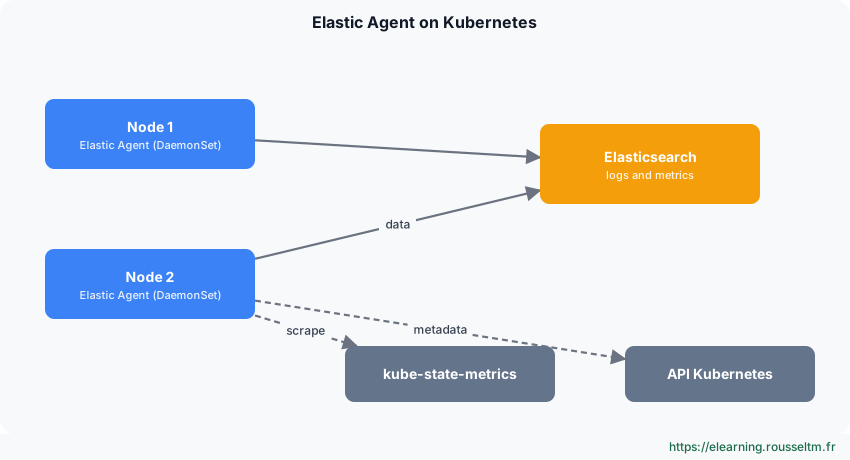
Elastic Agent runs as a DaemonSet: one pod per node reads container logs (/var/log/containers) and kubelet metrics. The Kubernetes integration also queries kube-state-metrics for object state (deployments, failing pods, restarts).
2. Deploying #
Fleet manifest or ECK.
Fleet-managed manifest #
helm repo add prometheus-community https://prometheus-community.github.io/helm-charts
helm install kube-state-metrics prometheus-community/kube-state-metrics -n kube-system
# Kibana › Fleet › Add agent › Kubernetes : télécharger le manifeste prérempli (FLEET_URL, FLEET_ENROLLMENT_TOKEN)
kubectl apply -f elastic-agent-managed-kubernetes.yml
kubectl -n kube-system get pods -l app.kubernetes.io/name=elastic-agent
Good to know: The manifest creates the service account, read-only RBAC roles and the DaemonSet; it mounts host log directories read-only.
With ECK #
apiVersion: agent.k8s.elastic.co/v1alpha1
kind: Agent
metadata:
  name: elastic-agent
spec:
  version: 9.x.y
  kibanaRef: { name: kibana }
  fleetServerRef: { name: fleet-server }
  mode: fleet
  policyID: eck-agent
  daemonSet:
    podTemplate:
      spec:
        serviceAccountName: elastic-agent
        automountServiceAccountToken: true
3. Autodiscovery #
Configuring through annotations.
Annotations and hints #
With hints, the agent reads pod annotations to automatically enable an integration (e.g. Redis) or a multiline parser for a given container, without changing the policy.
metadata:
  annotations:
    co.elastic.hints/package: redis
    co.elastic.hints/host: '${kubernetes.pod.ip}:6379'
    co.elastic.hints/period: 30s
Good practice: Set memory and CPU limits on the DaemonSet and watch its restarts: an agent killed for lack of memory loses collection continuity.
