1. Monitoring the fleet #
Fleet and agent monitoring.
States #

Enable agent monitoring in the policy: each agent ships its own logs and metrics (logs-elastic_agent*, metrics-elastic_agent*) and Fleet shows the state of each component.
On the host #
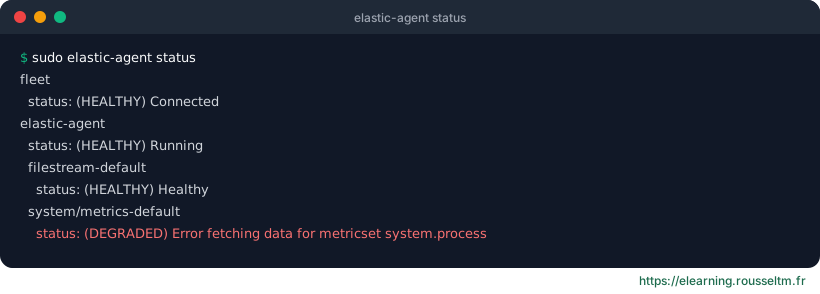
sudo elastic-agent status --output=full
sudo elastic-agent inspect           # politique effective
sudo journalctl -u elastic-agent -f  # journaux du service
2. Upgrading #
In batches, without interruption.
The approach #
- Upgrade Elasticsearch and Kibana first: the agent must not be newer than them.
- Upgrade Fleet Server.
- Upgrade a pilot batch of agents from Fleet (select by policy or tag).
- Roll out with a progressive (rolling) or scheduled upgrade.
sudo elastic-agent upgrade 9.x.y # agent autonome ; les agents gérés se mettent à jour depuis Fleet3. Troubleshooting #
Diagnostics and common problems.
The diagnostics bundle #
sudo elastic-agent diagnostics   # crée un .zip : politique, logs, état, profils
# ou depuis Fleet : Agent › Actions › Request diagnostics .zip
Common problems #
| Symptom | Likely cause | Check |
|---|---|---|
| Agent offline | Fleet Server unreachable, proxy, firewall | curl -v https://fleet.exemple.fr:8220/api/status |
| Healthy agent but no data | Wrong Elasticsearch output, API key permissions | agent logs: 401/403 errors |
| Certificate error | Missing certificate authority | --certificate-authorities |
| Missing logs | Wrong path or read permissions | elastic-agent inspect |
| Duplicate documents | Beat and integration on the same files | stop the old collector |
Air-gapped sites #
Good to know: Without Internet access, host the Elastic Package Registry and the agent binary registry internally, then set their URLs in Kibana (Fleet › Settings).
