1. Where waste comes from #
What costs without serving.
Sources of useless volume #
- Empty or redundant fields: a firewall log often has over 100 fields, many of which are never used.
- Events with no security value: allowed traffic to internal DNS, health probes, debug logs.
- Duplicates: the same message repeated thousands of times per minute during an incident.
- Needless detail for the use: a dashboard showing only counts does not need every event.
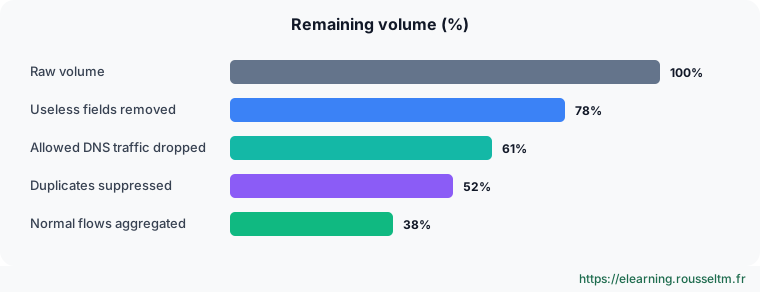
The percentages in the diagram are illustrative: measure on your own data, gains vary widely by source.
2. The techniques #
From safest to most aggressive.
Overview #
| Technique | Function | Information loss |
|---|---|---|
| Remove empty or useless fields | Eval (Remove), Serialize (field list), Parser in “reserialize” mode | none if well chosen |
| Drop events with no value | Drop, Regex Filter | total for those events (archive them elsewhere) |
| Suppress duplicates | Suppress | low: a counter keeps track |
| Aggregate | Aggregations, Rollup Metrics | individual detail |
| Sample | Sampling, Dynamic Sampling | statistical; keep for very repetitive flows |
| Turn into metrics | Publish Metrics, Aggregations | log text |
Typical settings #
# Aggregations: 1 event per minute per source/destination pair instead of thousands
time window: 60s
aggregations: [ "count().as(flows)", "sum(bytes).as(bytes)" ]
group by: [ src_ip, dst_ip, dst_port, action ]

# Suppress: one identical event every 5 minutes, with the suppressed count
key expression: `${host}:${message}`
number to allow: 1
suppression period: 300

# Dynamic Sampling: sample more what is very frequent
sample mode: logarithmic
group by key: `${status}:${uri}`
These settings are entered in function forms; the excerpt summarizes the main fields.
3. Reducing without losing anything #
The dual flow.
Full archive, reduced SIEM #
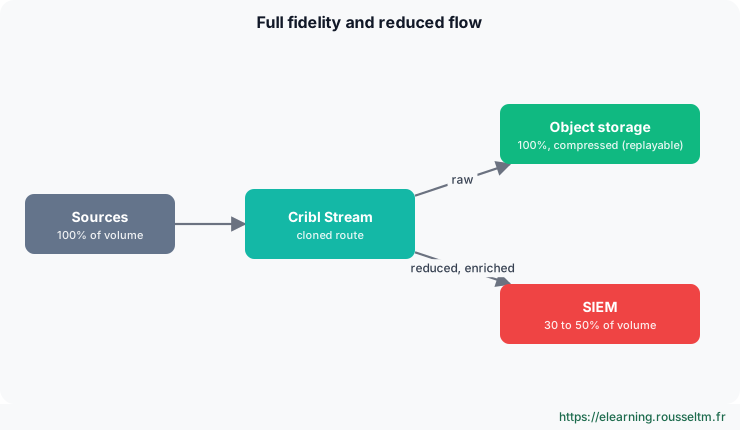
- A first non-final route sends 100% of raw data to object storage, compressed.
- A second route applies the reduction pipeline and sends the result to the SIEM.
- For an investigation, you replay the useful period from the archive to the SIEM (next chapter).
Best practice : This architecture makes reduction reversible: the security team accepts filtering far more easily when it knows it can recover everything.
4. Protecting and measuring #
Mask, then prove the gain.
Masking #
- Mask replaces by regular expression: card numbers, e-mail addresses, tokens, passwords in URLs.
- Hash rather than delete (
C.Mask.sha256()) when you need to correlate without knowing the value. - Mask in the processing pipeline, before any external destination, including the archive if it leaves your perimeter.
Measuring #
- Monitoring › Data: incoming and outgoing bytes and events per source, route, pipeline and destination.
- Compare route input and SIEM output over a week; present the gain in GB per day and in licence cost avoided.
- Check with the security team that detections stay identical (same alerts over the same period).
Watch out : Never drop an event type without agreement from the teams using it: a detection rule may rely on a log that looks useless.
Commands to know #
Commands to know
action=='allow' && dst_port==53: typical Drop filtercount().as(flows): count aggregationC.Mask.sha256(email): pseudonymize by hashingMonitoring › Data › Routes: measure reduction
Sources #
Checked in November 2026 (Cribl 4.20): Cribl ships a minor release about every two months, check the release notes before relying on a detail.
My progress
Sign in to track your progress and take notes. Sign in
💬 Questions about this lesson
No questions yet: be the first to ask for help or share your configuration.
Recommended Articles
Automating Cribl: REST API, Packs, Git and Terraform
Managing Cribl as code: REST API (authentication, group paths, commit and deploy), reusable Packs...
Bindplane best practices
Checklist for operating Bindplane: organizing by labels and fleets, measured reduction, masking a...
Advanced Datadog logs: indexes, exclusion filters, Flex Logs, archives and Sensitive Data Scanner
Control the cost and compliance of Datadog logs: pipelines and processors, indexes and retention,...
Installing and administering Cribl Stream
Installing Cribl Stream with Docker or on Linux, running it as a service, understanding $CRIBL_HO...
Advanced logs with OpenPipeline: processing, masking, buckets and retention
Manage logs in Dynatrace with OpenPipeline: ingestion, routing, DQL processing (parsing, enrichme...
OpenTelemetry Collector: processors (transforming, filtering and protecting telemetry)
Master OpenTelemetry Collector processors: batch, memory_limiter, attributes, resource, filter, t...
Grafana Alloy: collecting and transforming telemetry
Learn how to use Grafana Alloy to collect, transform and route logs, metrics and traces. Discover...
Fluent Bit: parsers and filters, structuring and transforming logs
Structure and transform logs in Fluent Bit: parsers (json, regex, logfmt, ltsv), multiline parser...
Vector: transforms in detail (remap and VRL, route, filter, reduction and metrics)
Transform events in Vector: remap and the VRL language (parsing, enrichment, error handling), rou...