1. Introduction to continuous profiling #
Continuous profiling with Pyroscope.
The fourth signal #
Metrics say that the service consumes too much, traces say where the request loses time, and profiles say which function is responsible. A profile samples what the program does: call stack on the CPU, memory allocations, goroutines.
| Signal | Question | Example answer |
|---|---|---|
| Metric | Is there a problem? | CPU at 90% |
| Trace | Which step is slow? | Cart calculation: 800 ms |
| Profile | Which line of code? | calculTVA(): 60% of CPU |
Why “continuous”? #
Classic profiling is started by hand once the problem is spotted, and it is often too late to reproduce it. Continuous profiling records all the time, with low overhead. You can then compare yesterday's version with today's, or examine an incident from last night.
Profile types #
| Type | Measures | To find |
|---|---|---|
| CPU | Time spent per function | Expensive computations, loops |
| Memory (allocations) | What gets allocated | Garbage collector pressure |
| Memory (in use) | What stays in memory | Leaks |
| Goroutines, threads | Count and stacks | Deadlocks, goroutine leaks |
| Mutex, block | Waiting time | Contention |
Reading a flame graph #
Pyroscope displays profiles as a flame graph: each rectangle is a function, its width shows its share of the total. Look for wide rectangles: those are the ones to optimize. The horizontal axis is not time.
Pyroscope is the successor to Grafana Phlare. See the dedicated Grafana Pyroscope course to go further.
2. Setting up data collection #
Configuration of scraping and forwarding for Pyroscope.
Three ways to collect #
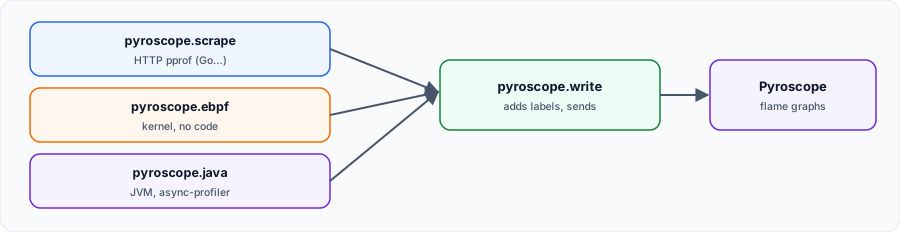
| Component | Principle | Requirement |
|---|---|---|
pyroscope.scrape | Queries pprof endpoints over HTTP | The application exposes pprof (Go…) |
pyroscope.ebpf | Observes the CPU from the kernel | Linux, root privileges; CPU only |
pyroscope.java | Attaches async-profiler to JVMs | Access to Java processes |
Collecting over HTTP #
In Go, exposing the pprof endpoints is enough:
import _ "net/http/pprof"

go func() {
    http.ListenAndServe(":6060", nil)
}()
Alloy queries them like metrics:
pyroscope.scrape "app" {
  targets         = [{ "__address__" = "app:6060", "service_name" = "boutique" }]
  scrape_interval = "15s"
  forward_to      = [pyroscope.write.backend.receiver]

  profiling_config {
    profile.process_cpu {
      enabled = true
    }
    profile.memory {
      enabled = true
    }
    profile.goroutine {
      enabled = true
    }
  }
}

pyroscope.write "backend" {
  endpoint {
    url = "http://pyroscope:4040"
  }
  external_labels = { env = "prod" }
}| Setting | Default |
|---|---|
scrape_interval | 15s |
scrape_timeout | 10s |
delta_profiling_duration | 14s |
Tested by profiling Alloy itself, which exposes pprof on its HTTP port: in just over 30 seconds, the backend received 6 pushes on /push.v1.PusherService/Push.
The service name matters: add service_name to your targets: it is how you find the application in Pyroscope. And never expose the pprof port on the Internet.Without touching the code: eBPF #
discovery.process "tous" {
}

pyroscope.ebpf "hote" {
  targets    = discovery.process.tous.targets
  forward_to = [pyroscope.write.backend.receiver]
}

pyroscope.write "backend" {
  endpoint {
    url = "http://pyroscope:4040"
  }
}
pyroscope.ebpf profiles processes from the kernel, in any language. It requires running Alloy as root (or in a privileged container), and it only measures CPU. We validated this configuration with alloy validate without running it: the test requires root privileges.
Choosing #
| Situation | Choice |
|---|---|
| Go applications | pyroscope.scrape: memory, goroutines and CPU |
| Mixed fleet, code that cannot change | pyroscope.ebpf |
| Java applications | pyroscope.java |
| Need for fine business labels | Pyroscope SDK in the application, direct push |
You can link profiles to traces: add the same labels (service_name, env) on both sides to navigate from one to the other in Grafana.
