1. What is Grafana Alloy? #
Understand the transition from the static Agent to Alloy.
The evolution of the Grafana agent #
Available in: ✓ OSS ✓ Enterprise ✓ Cloud

Grafana Alloy is the telemetry collector from Grafana Labs, under the Apache 2.0 license. It receives, transforms and sends the four signals: metrics, logs, traces and profiles. It succeeds Grafana Agent and Promtail, both end-of-life (Grafana Agent on November 1, 2025, Promtail on March 2, 2026) (see the Alloy, Grafana Agent and Promtail lesson).
It solves a concrete problem: without it, a server often runs a node_exporter, a Promtail, an OpenTelemetry Collector and a profiling agent, each with its own configuration. Alloy replaces all that with one process and one language.
What Alloy is not #
| Misconception | Reality |
|---|---|
| Alloy stores data | No: it passes it on to Mimir, Loki, Tempo, Pyroscope or any compatible backend |
| Alloy only works with Grafana | No: it also sends OTLP and Prometheus remote write to other platforms |
| Alloy is the OpenTelemetry Collector | It embeds some of its components (otelcol.*), but has its own language and engine |
2. The "Programmable Pipelines" concept #
Introduction to declarative syntax.
Why “programmable”? #
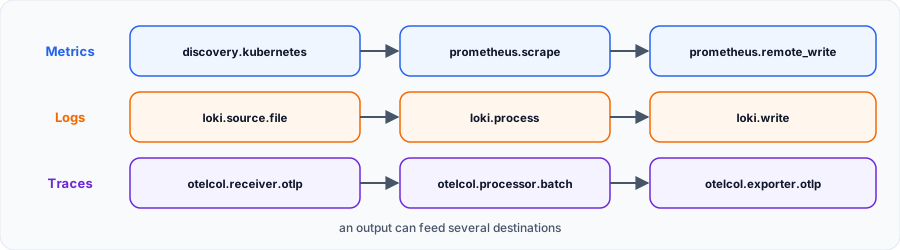
A classic agent is configured with a big YAML file: you describe what to collect, and its internals stay fixed. Alloy reverses this: you assemble components like building blocks and decide the path of your data.
A first pipeline #
Two components are enough. One scrapes, the other sends. The link between them is a simple reference:
prometheus.scrape "app" {
  targets    = [{ "__address__" = "localhost:8080" }]
  forward_to = [prometheus.remote_write.mimir.receiver]
}

prometheus.remote_write "mimir" {
  endpoint {
    url = "http://mimir:9009/api/v1/push"
  }
}
forward_to points to receiver, a value published (exported) by the other component. That is the whole mechanism of the language: an output is plugged into an input. Block order in the file does not matter, because Alloy deduces the execution order from these references.
What assembling allows #
Sending to several destinations. forward_to is a list: the same metrics go to two backends without duplicating collection.
prometheus.relabel "filtre" {
  rule {
    source_labels = ["__name__"]
    regex         = "go_gc_.*"
    action        = "drop"
  }
  forward_to = [
    prometheus.remote_write.mimir.receiver,
    prometheus.remote_write.cloud.receiver,
  ]
}

prometheus.remote_write "mimir" {
  endpoint {
    url = "http://mimir:9009/api/v1/push"
  }
}

prometheus.remote_write "cloud" {
  endpoint {
    url = sys.env("GRAFANA_CLOUD_URL")
  }
}
Deciding on content. Here, debug logs are discarded before sending. In our tests, out of 4 lines read, 3 reached Loki.
loki.process "routage" {
  forward_to = [loki.write.long_terme.receiver]

  stage.json {
    expressions = { level = "" }
  }

  stage.drop {
    source = "level"
    value  = "debug"
  }
}

loki.write "long_terme" {
  endpoint {
    url = "http://loki:3100/loki/api/v1/push"
  }
}
Reusing. The same processing is factored with declare and shared with import.git (see the Variables and Functions lesson).
Static or programmable #
| Classic YAML agent | Alloy | |
|---|---|---|
| Configuration | Predefined sections | Freely assembled components |
| Data path | Set by the tool | Described by your references |
| Target change | Often a global reload | Only affected components are re-evaluated |
| Reuse | Copy and paste | declare, import.* |
Remember: read an Alloy configuration by following the forward_to. You get the real data path, and the UI on port 12345 draws this same graph.3. Internal architecture #
Components, services, and the Directed Acyclic Graph (DAG).
The component, the basic building block #
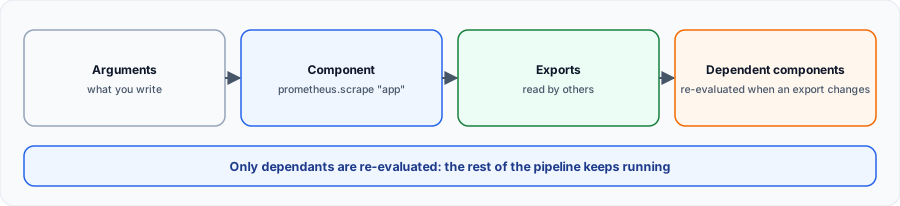
Everything rests on the component. It receives arguments (what you write), runs continuously and publishes exports that other components read. It also has a health state, visible in the UI and through the API.
The graph (DAG) #

At load time, the controller builds a directed acyclic graph (DAG) from the references. It first evaluates components with no dependency, then moves up. After that, when a component publishes a new export, only its dependants are re-evaluated. A newly discovered pod therefore does not disturb log sending.
The graph imposes rules, checked at load time. Here are the real messages from Alloy 1.21:
cycle detected: prometheus.relabel.a, prometheus.relabel.b
block prometheus.remote_write.a already declared at du.alloy:1:1
component "prometheus.remote_write.absent.receiver" does not exist or is out of scope| Error | Cause | Fix |
|---|---|---|
cycle detected | A sends to B, which sends to A | Break the loop: the graph must stay acyclic |
already declared | Two components with the same name and label | Change the label |
does not exist or is out of scope | Reference to a missing component | Check the spelling or the scope of a declare |
Where is the data? #
Some components write to disk, in the --storage.path folder (data-alloy by default). We found there, for example, the prometheus.remote_write WAL and the loki.source.file positions. Make this folder persistent: without it, a restart re-reads files or loses pending metrics.
Reloading without interruption #
A POST /-/reload reloads the configuration. We checked two cases:
- Valid configuration:
config reloadedresponse. - Invalid configuration: 400 response, and running components keep running with the old configuration.
Best practice:alloy runaccepts a folder and loads all its.alloyfiles. Split by domain:10-collecte.alloy,20-envoi.alloy. We tested it: references work from one file to another.
4. Installation #
Deployment on Linux, Docker, and Kubernetes.
Which method to choose? #
| Environment | Method | For |
|---|---|---|
| Linux servers | deb or rpm package | systemd service, updates through the package manager |
| Workstation, CI, prototype | Docker | Quick trial without touching the system |
| Kubernetes | Helm chart | DaemonSet or cluster (see the dedicated chapter) |
| No privileges | GitHub binary | One-off trial |
With Docker #
docker run --name alloy \
  -v "$PWD/config.alloy:/etc/alloy/config.alloy" \
  -p 12345:12345 \
  grafana/alloy:v1.21.3 \
  run --server.http.listen-addr=0.0.0.0:12345 \
      --storage.path=/var/lib/alloy/data \
      /etc/alloy/config.alloy
The UI does not respond? By default, Alloy listens on127.0.0.1:12345, so only inside the container. Hence the--server.http.listen-addr=0.0.0.0:12345option. Outside a container, keep the default, or protect this port: the UI exposes the configuration.
On Debian or Ubuntu #
sudo mkdir -p /etc/apt/keyrings
sudo wget -O /etc/apt/keyrings/grafana.asc https://apt.grafana.com/gpg-full.key
echo "deb [signed-by=/etc/apt/keyrings/grafana.asc] https://apt.grafana.com stable main" \
  | sudo tee /etc/apt/sources.list.d/grafana.list
sudo apt-get update
sudo apt-get install alloy

sudo systemctl enable --now alloy
sudo systemctl status alloy
sudo journalctl -u alloy -f
The configuration lives in /etc/alloy/config.alloy. Service options are in /etc/default/alloy (/etc/sysconfig/alloy on RHEL): CUSTOM_ARGS takes the listen address, for example.
On Kubernetes #
helm repo add grafana https://grafana.github.io/helm-charts
helm repo update
helm install alloy grafana/alloy -n monitoring --create-namespace -f values.yaml
Deployment and its modes are covered in the Deploying at scale chapter.
Checking the installation #
alloy --version
alloy validate config.alloy
curl http://localhost:12345/-/ready     # Alloy is ready.
curl http://localhost:12345/-/healthy   # All Alloy components are healthy.
curl -X POST http://localhost:12345/-/reload # config reloaded| Check | Expected response |
|---|---|
/-/ready | Alloy is ready. |
/-/healthy | All Alloy components are healthy. |
http://localhost:12345 | UI and component graph |
Best practice: pin a precise image tag (grafana/alloy:v1.21.3), and runalloy validatein your CI before each deployment.
