1. Trace Ingestion #
Ingestion via OTLP or third-party protocols (Jaeger, Zipkin).
Receiving traces #
Available in: ✓ OSS ✓ Enterprise ✓ Cloud
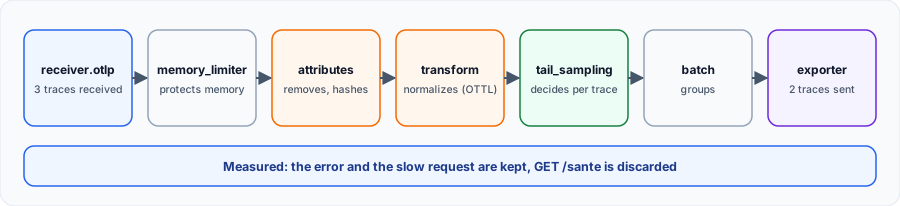
Instrumented applications send their traces to Alloy, which processes them and passes them to Tempo or another backend. Standard OTLP ports are 4317 (gRPC) and 4318 (HTTP).
otelcol.receiver.otlp "default" {
  grpc {
    endpoint = "0.0.0.0:4317"
  }
  http {
    endpoint = "0.0.0.0:4318"
  }
  output {
    traces = [otelcol.processor.memory_limiter.default.input]
  }
}

otelcol.processor.memory_limiter "default" {
  check_interval         = "1s"
  limit_percentage       = 80
  spike_limit_percentage = 20
  output {
    traces = [otelcol.processor.batch.default.input]
  }
}

otelcol.processor.batch "default" {
  output {
    traces = [otelcol.exporter.otlp.tempo.input]
  }
}

otelcol.exporter.otlp "tempo" {
  client {
    endpoint = "tempo:4317"
    tls {
      insecure = true
    }
  }
}
The recommended order #
| Step | Component | Why |
|---|---|---|
| 1 | memory_limiter | First: refuses data before the process runs out of memory |
| 2 | Processing | Attributes, transformations, sampling |
| 3 | batch | Just before sending: groups and reduces the number of requests |
| 4 | otelcol.exporter.otlp | Sending |
Error we hit:limit_percentagealone is refused at startup (“limit_percentage and spike_limit_percentage must be greater than 0”). Set both: that is why the example also setsspike_limit_percentage.
batch setting | Default |
|---|---|
timeout | 200ms |
send_batch_size | 2000 |
send_batch_max_size | 3000 |
Accepting older formats #
During a migration, Alloy also receives Jaeger and Zipkin, then converts everything to the same pipeline. Existing applications have nothing to change.
otelcol.receiver.jaeger "historique" {
  protocols {
    grpc {}
  }
  output {
    traces = [otelcol.processor.batch.default.input]
  }
}

otelcol.receiver.zipkin "historique" {
  output {
    traces = [otelcol.processor.batch.default.input]
  }
}

otelcol.processor.batch "default" {
  output {
    traces = []
  }
}
Checking #
Temporarily plug otelcol.exporter.debug as output: it prints each span in Alloy's logs. This component is experimental: run Alloy with --stability.level=experimental. The otelcol_receiver_accepted_spans_total and otelcol_exporter_sent_spans_total metrics then let you compare input and output.
0.0.0.0:4318makes the receiver reachable from other machines. On a shared host, restrict access or add authentication withotelcol.auth.*.
2. Transformation and Sampling #
Adapting spans and sampling.
Cleaning attributes #
A trace can contain sensitive data. otelcol.processor.attributes removes or masks it before it leaves your network.
otelcol.processor.attributes "nettoyage" {
  action {
    key    = "http.request.header.authorization"
    action = "delete"
  }
  action {
    key    = "user.email"
    action = "hash"
  }
  action {
    key    = "deployment.environment.name"
    value  = "prod"
    action = "upsert"
  }
  output {
    traces = []
  }
}| Received attribute | Sent attribute (measured) |
|---|---|
http.request.header.authorization: Bearer secret | Deleted |
user.email: alice@exemple.fr | 182e2bdf10871ea9… (hashed) |
| Missing | deployment.environment.name: prod |
Hashing keeps a stable value: you can still count affected users without knowing their address.
Normalizing with OTTL #
otelcol.processor.transform runs OTTL statements. Here we group GET /produits/42, GET /produits/43… under a single name: otherwise each ID creates a separate operation and dashboards become unreadable.
otelcol.processor.transform "noms" {
  error_mode = "ignore"
  trace_statements {
    context    = "span"
    statements = [
      `set(attributes["http.route"], "/produits/{id}") where IsMatch(name, "^GET /produits/[0-9]+$")`,
      `set(name, "GET /produits/{id}") where IsMatch(name, "^GET /produits/[0-9]+$")`,
    ]
  }
  output {
    traces = []
  }
}
Observed result: the span is called GET /produits/{id} and carries http.route=/produits/{id}. Order matters: write the attribute before renaming, or the condition no longer matches.
Sampling intelligently #
Keeping all traces is expensive. There are two approaches:
Head (probabilistic_sampler) | Tail (tail_sampling) | |
|---|---|---|
| Decision | At the first span | After seeing the trace |
| Keeps errors? | No, it is random | Yes |
| Cost | Very low | Memory: traces are held |
otelcol.processor.tail_sampling "decision" {
  decision_wait = "30s"
  num_traces    = 50000

  policy {
    name = "garder-les-erreurs"
    type = "status_code"
    status_code {
      status_codes = ["ERROR"]
    }
  }

  policy {
    name = "garder-les-lentes"
    type = "latency"
    latency {
      threshold_ms = 1000
    }
  }

  policy {
    name = "echantillon-du-reste"
    type = "probabilistic"
    probabilistic {
      sampling_percentage = 5
    }
  }

  output {
    traces = []
  }
}
A trace is kept as soon as one policy accepts it. We tested errors and latency (with decision_wait reduced to 5 s) on 3 traces:
| Trace | Result |
|---|---|
GET /produits/42 failing, 20 ms | Kept |
GET /sante successful, 10 ms | Discarded |
POST /payer successful, 2500 ms | Kept |
otelcol_receiver_accepted_spans_total was 3, and otelcol_exporter_sent_spans_total 2.
With several instances: all spans of a trace must reach the same instance. In front of several Alloy instances, addotelcol.exporter.loadbalancingwithrouting_key = "traceID".decision_wait(30 s by default) andnum_traces(50000) determine the memory needed.
Producing metrics from traces #
To keep real rates despite sampling, generate metrics before it: forward received traces both to this connector and to the pipeline.
otelcol.connector.spanmetrics "red" {
  histogram {
    explicit {
      buckets = ["100ms", "500ms", "2s"]
    }
  }
  output {
    metrics = [otelcol.exporter.prometheus.vers_prom.input]
  }
}

otelcol.exporter.prometheus "vers_prom" {
  forward_to = [prometheus.remote_write.mimir.receiver]
}

prometheus.remote_write "mimir" {
  endpoint {
    url = "http://mimir:9009/api/v1/push"
  }
}
2026 update: what has changed #
Recent changes worth knowing (checked in November 2026).
2026 landmarks #
Grafana Alloy ships a minor release roughly every three weeks; 1.21 (October 2026) is the latest at the time of this update. Read the release notes before each upgrade: some releases bring a new Prometheus or OpenTelemetry Collector branch, with flagged breaking changes.
- Jaeger v2, rebuilt on the OpenTelemetry Collector, has replaced v1: it receives OTLP natively, and legacy Jaeger formats are only needed for older applications.
- OTTL is stable (v1) for traces: the transformations described above can be used in production without fear of syntax changes.
- Stabilized semantic conventions (HTTP, databases) make it easier to generate RED metrics from spans.
