1. Why VictoriaMetrics? #
A resource-efficient time series database.
The promises #
VictoriaMetrics is a Prometheus-compatible time series database (remote write ingestion, query API, PromQL), designed to use little memory, CPU and disk. It can serve as long-term storage for Prometheus or as a full replacement.
| Strength | Detail |
|---|---|
| Efficiency | Very effective compression (often less than one byte per sample), low memory per active series |
| Simplicity | A single binary with no dependencies in single-node mode, local disk storage |
| Compatibility | Prometheus remote write, Prometheus API, Graphite, InfluxDB, OpenTSDB, OTLP, DataDog |
| MetricsQL | A superset of PromQL with extra functions |
| Ecosystem | vmagent, vmalert, vmbackup, Kubernetes operator, VictoriaLogs for logs |
Good to know: VictoriaMetrics is open source (Apache 2.0). An enterprise version notably adds downsampling, per-series retention filters and security features.
2. The components #
Each with its own role.
Overview #
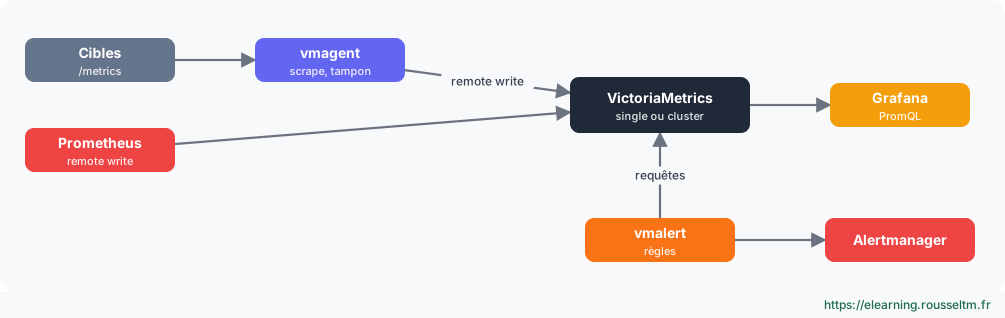
| Component | Port | Role |
|---|---|---|
| victoria-metrics (single-node) | 8428 | Ingestion, storage and queries in a single process |
| vmagent | 8429 | Collection (scrape), relabeling, disk buffer, remote write to one or more stores |
| vmalert | 8880 | Recording and alerting rules, sending to Alertmanager |
| vminsert / vmselect / vmstorage | 8480 / 8481 / 8482 | Cluster version: separate write, read and storage |
| vmbackup / vmrestore | - | Incremental backups to object storage |
| vmui | /vmui | Built-in interface for exploration and cardinality analysis |
3. Single node or cluster? #
The single node goes a long way.
Choosing #
| Criterion | Single node | Cluster |
|---|---|---|
| Volume | Up to several million active series | Beyond that, horizontal scaling |
| Availability | One instance (two instances in parallel for HA) | Data replication |
| Multi-tenant | No | Yes (account identifier in the URL) |
| Operations | Very simple | Three components to size |
Good practice: Start with the single node: it covers the vast majority of needs and can be migrated to the cluster (vmctl) if necessary.
4. Getting started #
One command.
Startup #
docker run -d --name vm -p 8428:8428 -v vmdata:/victoria-metrics-data \
  victoriametrics/victoria-metrics:latest \
  -retentionPeriod=1y -storageDataPath=/victoria-metrics-data
curl -s localhost:8428/health
# Interface : http://localhost:8428/vmui
Good to know: Without a unit,-retentionPeriodis expressed in months (-retentionPeriod=12); you can also write90d,1y. Grafana connects with a Prometheus data source pointing tohttp://vm:8428.
