
1. What is Grail? #
A lakehouse for all data.
The idea #
A data lakehouse combines the cheap storage of a data lake with the fast queries of a data warehouse. Grail is the Dynatrace one: data is stored without an imposed schema or pre-built index, and its structure is interpreted at query time (schema on read).
| Data type | Examples | DQL command |
|---|---|---|
| Logs | application, system, container logs | fetch logs |
| Metrics | CPU, response time, custom metrics | timeseries |
| Traces (spans) | distributed requests, database calls | fetch spans |
| Events | Davis problems, deployments, business events, billing | fetch events, fetch bizevents, fetch dt.system.events |
| Entities | hosts, services, process groups (topology) | fetch dt.entity.host |
Depending on the version: Grail is available on Dynatrace SaaS (new platform), not on Dynatrace Managed. The oldest SaaS environments may still use classic log management until they migrate.
2. Collection, buckets and retention #
Where data goes.
From collection to storage #
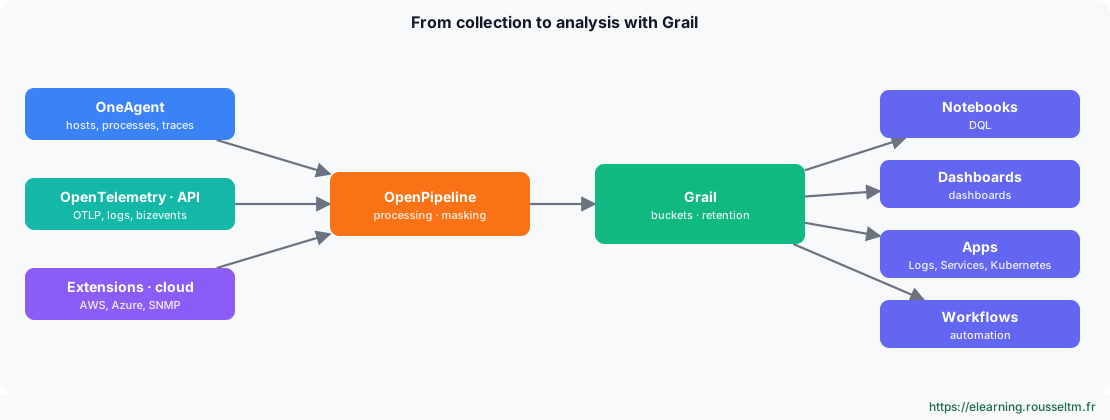
Data arrives through OneAgent, OpenTelemetry (OTLP), the ingest API, extensions and cloud integrations. OpenPipeline processes it before storage: field parsing, masking of sensitive data, metric extraction, routing to a bucket (see Advanced logs with OpenPipeline).
Buckets #
Grail stores data in buckets, each with its own retention period. Default buckets (for example default_logs) can be complemented by dedicated buckets: audit logs kept for a year, debug logs kept for a few days.
Good practice: Create buckets by retention period and audience (team, sensitivity): retention, rights and cost are then managed per bucket. Details in Data retention in Dynatrace.
3. The DQL language #
Chained commands.
The syntax #
A DQL query is a sequence of commands separated by a pipe |: each command receives the result of the previous one. Start with a source (fetch, timeseries), filter early, then transform and aggregate.
fetch logs, from: -2h
| filter k8s.namespace.name == "boutique" and loglevel == "ERROR"
| parse content, "LD 'status=' INT:status"
| summarize erreurs = count(), by: { dt.entity.service, status }
| sort erreurs desc
| limit 10
This query reads two hours of logs, keeps errors from the boutique namespace, extracts the status code with parse (DPL pattern), counts errors per service and status, then keeps the ten most frequent.
timeseries cpu = avg(dt.host.cpu.usage), by: { dt.entity.host }, from: -24h
| fieldsAdd hote = entityName(dt.entity.host)
| sort arrayAvg(cpu) desc
| limit 5
timeseries queries metrics; entityName() replaces the host ID with its name.
Commands to know #
| Command | Purpose |
|---|---|
fetch | read a source: logs, spans, events, bizevents, entities |
timeseries | query metrics as time series |
filter / filterOut | keep or exclude records |
parse | extract fields from text (DPL patterns) |
fields / fieldsAdd / fieldsRemove | choose, compute or remove fields |
summarize | aggregate: count(), avg(), percentile()… with by: {} |
makeTimeseries | turn records (logs, events) into a time series |
lookup / join | enrich with another query |
sort / limit | sort and limit the result |
To go further: DQL in practice and Advanced Grail and DQL.
4. Using the data #
Notebooks, dashboards, apps, workflows.
Where to use a DQL query #
| App | Use |
|---|---|
| Notebooks | explore, document an analysis, share an investigation |
| Dashboards | track indicators in DQL-driven tiles |
| Apps (Logs, Services, Kubernetes…) | ready-made analyses, each built on Grail |
| Workflows | run a scheduled or event-triggered query, then act (notification, ticket, API) |
FinOps example: a weekly workflow computes the average CPU and memory usage of virtual machines over 30 days and opens a downsizing request for those staying below 30% (see Workflows and AutomationEngine).
5. Access rights and costs #
Governing Grail.
Who sees what #
Access to Grail data is set with IAM policies (for example reading logs, reading certain buckets), possibly restricted by conditions or policy boundaries. Segments filter views; they do not grant rights (see Managing permissions).
What is billed #
With DPS licensing, Grail is billed on ingestion, retention and queries (volume of data read). A poorly targeted query over months of logs is expensive (see Dynatrace licensing).
Common mistake: Running fetch logs with no time range or early filter over the whole retention: the result is slow and the query reads large volumes for nothing. Narrow the time range, filter on the second line and target the bucket.