1. Writing efficient queries #
Cost depends on the data read.
How a query runs #
Grail has no pre-built index: a query reads the data for the requested time range and source, then applies the commands in order. What matters most is therefore the amount of data read: the time range, the source and the first filter. With DPS licensing, this volume is also what is billed (see Dynatrace licensing).

// Avoid: whole retention, late filter, useless fields
fetch logs
| fieldsAdd msg = lower(content)
| filter contains(msg, "timeout")
| summarize count(), by: { host.name }
// Better: short window, filter first, useful fields only
fetch logs, from: -2h, scanLimitGBytes: 50
| filter k8s.namespace.name == "shop" and contains(content, "timeout", caseSensitive: false)
| fields timestamp, host.name, content
| summarize timeouts = count(), by: { host.name }
| sort timeouts desc| fetch option | Effect |
|---|---|
from: / to: | limits the period read (overrides the UI time selector) |
scanLimitGBytes: | caps the volume read: protects against an overly broad query |
samplingRatio: | reads a sample (estimates, trends on large volumes) |
Anti-patterns #
| Avoid | Why | Do instead |
|---|---|---|
| fetch with no time range over the whole retention | reads everything | from: -2h, then widen |
| transforming before filtering | computes on useless rows | filter on line 2 |
| contains on the whole text when a field exists | costly text scan | filter on the field (loglevel, k8s.namespace.name) |
| heavy query refreshed every minute in a dashboard | cost multiplied by visits | short period, aggregation, metric extracted by OpenPipeline |
Good practice: For an indicator viewed constantly (a service error rate), extract a metric with OpenPipeline at ingestion rather than recomputing it from logs on every display (see Advanced logs with OpenPipeline).
2. Parsing text: parse, DPL and JSON #
Turning a message into fields.
DPL patterns #
parse extracts fields with a DPL pattern (Dynatrace Pattern Language): you describe the line with typed elements (IPADDR, INT, WORD, TIMESTAMP…) and literals in single quotes. LD (line data) consumes everything up to the next literal.
fetch logs, from: -1h
| filter log.source == "/var/log/nginx/access.log"
| parse content, "IPADDR:client SPACE LD '"' WORD:method SPACE NSPACE:url LD '" ' INT:status SPACE INT:bytes"
| filter status >= 500
| summarize errors = count(), by: { url, status }
| sort errors desc
| limit 20| DPL element | Matches |
|---|---|
INT, LONG, DOUBLE | numbers |
WORD, NSPACE | word, non-space text |
IPADDR | IPv4 or IPv6 address |
TIMESTAMP('yyyy-MM-dd HH:mm:ss') | date in the given format |
LD | everything up to the next literal |
JSON | complete JSON object |
SPACE | whitespace |
Good practice: Build a pattern in a notebook on about ten lines (| limit 10), then generalise. If the parsing is needed by every query, move it to OpenPipeline: fields will be stored once and for all.JSON logs #
For a JSON log, parse content, "JSON:evt" creates an object; access sub-fields with the evt[key][subkey] notation and convert types (toLong, toDouble, toTimestamp).
fetch logs, from: -1h
| filter startsWith(content, "{")
| parse content, "JSON:evt"
| fieldsAdd user = evt[user][id], duration_ms = toLong(evt[duration_ms])
| filter duration_ms > 2000
| fields timestamp, user, duration_ms
3. Combining sources: lookup, join, append #
Cross-referencing data.
Three commands, three uses #
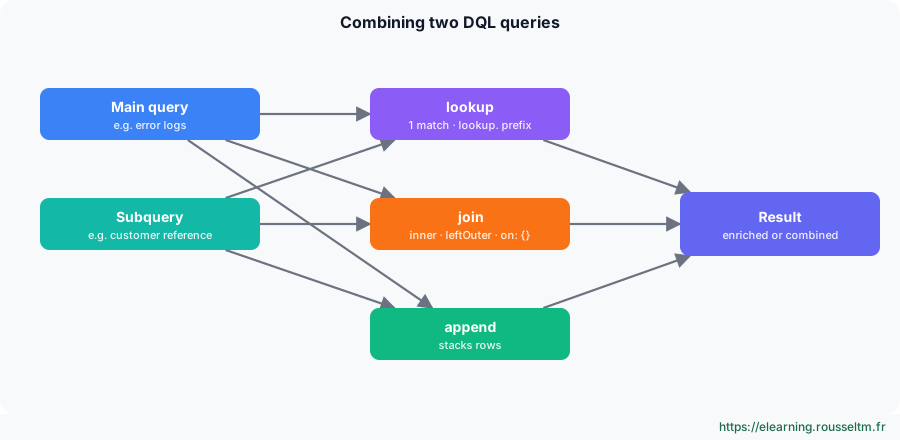
| Command | Result | When to use it |
|---|---|---|
lookup | each row gets at most one match, as prefixed fields (lookup. by default) | enrich with reference data (customer, team, owner) |
join | combines two results on a condition; kind: inner, leftOuter… | match two signals (spans and logs from the same trace) |
append | adds the subquery rows after the first ones | timeline mixing several sources |
lookup #
// Enrich errors with the customer's subscription tier (reference data in bizevents)
fetch logs, from: -1h
| filter loglevel == "ERROR" and isNotNull(customer.id)
| lookup [ fetch bizevents, from: -30d
           | filter event.type == "customer.profile"
           | fields customer.id, tier ],
  sourceField: customer.id, lookupField: customer.id, prefix: "customer_"
| summarize errors = count(), by: { customer_tier }
Common mistake: Forgetting thatlookupkeeps only one match: if the reference data has several rows per key, the result depends on order. Deduplicate the subquery (dedup customer.idorsummarize).
join #
// Match slow requests (spans) with error logs from the same trace
fetch spans, from: -30m
| filter request.is_root_span == true and duration > 2s
| fields trace.id, span.name, duration
| join [ fetch logs, from: -30m
         | filter loglevel == "ERROR" and isNotNull(trace_id)
         | fields trace_id, content ],
  on: { left[trace.id] == right[trace_id] }, kind: inner,
  fields: { content }
| limit 50
Depending on the version: Field names differ by source and version:trace.idon spans,trace_idon many logs, sometimes with different types (convert withtoString()ortoUid()if the join returns nothing). Check in a notebook.
append #
// Stack two sources into one result
fetch events, from: -24h
| filter event.kind == "DAVIS_PROBLEM"
| fields timestamp, source = "problem", title = event.name
| append [ fetch events, from: -24h
           | filter event.type == "CUSTOM_DEPLOYMENT"
           | fields timestamp, source = "deployment", title = event.name ]
| sort timestamp desc
4. Time series #
Charts from anything.
timeseries: querying metrics #
timeseries reads metrics and returns one row per dimension combination, with an array of values per interval. Operations between series use the [] notation (element by element), and functions such as arrayAvg, arrayMax… summarise an array.
// Several metrics, one row per host, then arithmetic between series
timeseries { cpu = avg(dt.host.cpu.usage), mem = avg(dt.host.memory.usage) },
  by: { dt.entity.host }, interval: 15m, from: -24h
| fieldsAdd host = entityName(dt.entity.host), pressure = (cpu[] + mem[]) / 2
| fieldsAdd peak = arrayMax(pressure)
| sort peak desc
| limit 10
makeTimeseries: building a series #
makeTimeseries turns records (logs, spans, events, bizevents) into a time series: useful when no metric exists yet.
// Request error rate, computed from spans
fetch spans, from: -6h
| filter request.is_root_span == true
| makeTimeseries { total = count(), failures = countIf(request.is_failed == true) },
  by: { service.name }, interval: 5m
| fieldsAdd error_rate = failures[] / total[] * 100
Good to know:countIf()counts rows matching a condition;failures[] / total[]divides the two series interval by interval.
5. Entities and correlation #
Linking signals to topology.
Querying entities #
Entities (hosts, services, process groups…) are queried with fetch dt.entity.<type>. entityName() turns an ID into a readable name, and classicEntitySelector() reuses the entity selector syntax (see Mastering entity selectors).
// Entities: the services of a namespace, with their name and tags
fetch dt.entity.service
| filter in(id, classicEntitySelector("type(SERVICE),tag(\"k8s.namespace.name:shop\")"))
| fields id, entity.name, tags
| sort entity.name asc
Depending on the version: Topology is moving to Smartscape on Grail, with new commands to traverse relationships: check the DQL reference of your environment before using them.
Correlating logs, traces and metrics #
By aggregating each signal on the same key (often dt.entity.service), you get a diagnostic table in one query:
// Correlate: log errors and span latency, per service, over the same period
fetch spans, from: -1h
| filter request.is_root_span == true
| summarize p90 = percentile(duration, 90), requests = count(), by: { dt.entity.service }
| lookup [ fetch logs, from: -1h
           | filter loglevel == "ERROR"
           | summarize errors = count(), by: { dt.entity.service } ],
  sourceField: dt.entity.service, lookupField: dt.entity.service
| fieldsAdd service = entityName(dt.entity.service), errors = coalesce(lookup.errors, 0)
| fields service, requests, p90, errors
| sort errors desc
Good practice: Aggregate before combining: joining two summaries of a few dozen rows is instant, joining millions of raw rows is not.
6. Commands and functions to know #
The cheat sheet.
Commands #
| Command | Purpose |
|---|---|
fetch, timeseries | sources: records or metrics |
filter, filterOut, dedup | select, exclude, deduplicate |
parse, fieldsAdd, fields, fieldsRemove | extract, compute, choose fields |
summarize, makeTimeseries | aggregate, build a series |
lookup, join, append | enrich, combine, stack |
expand | one row per array element |
sort, limit | sort, limit |
Functions #
| Function | Example |
|---|---|
count(), countIf(), avg(), percentile() | percentile(duration, 90) |
contains(), startsWith(), matchesPhrase() | contains(content, "timeout", caseSensitive: false) |
in(), isNotNull(), coalesce() | coalesce(lookup.errors, 0) |
entityName(), classicEntitySelector() | entityName(dt.entity.host) |
toLong(), toString(), toTimestamp() | toLong(evt[duration_ms]) |
bin(), arrayAvg(), arrayMax() | summarize count(), by: { bin(timestamp, 1h) } |
7. Solved exercises #
Practise in a notebook.
Exercise 1: failing URLs #
From the last hour of Nginx access logs, list the 10 URLs returning the most 5xx errors. Solution: the query in section 2 (DPL parse, filter status >= 500, summarize by URL).
Exercise 2: error rate per service #
Chart the error rate of each service over 6 hours, in 5-minute buckets, without using an existing metric. Solution: the makeTimeseries query in section 4.
Exercise 3: one-query diagnosis #
Produce a table giving, for each service, the number of requests, the 90th percentile duration and the number of error logs. Solution: the correlation query in section 5; then check that the query reads less than a few GB by narrowing the period.
To review the basics: Grail: the Dynatrace data lakehouse and DQL in practice.
