1. What ClickStack is #
An integrated stack on ClickHouse.
The principle #
Available in: ✓ Open source ✓ Managed ClickStack open source · also offered managed in ClickHouse Cloud
ClickStack is the observability stack published by ClickHouse since 2025. It brings together three building blocks preconfigured to work together: an OpenTelemetry collector receiving logs, traces, metrics and sessions, ClickHouse storing them in optimized tables, and a UI (from HyperDX, acquired by ClickHouse in 2025) to search, correlate, visualize and alert.

Why ClickHouse? #
- Compression: highly repetitive telemetry often compresses 10 to 20 times in columnar storage.
- High cardinality: filtering by
trace_id,user_idorpodcosts no more than any other field, unlike label-based systems. - SQL: anything the UI does not do can be done in SQL, with joins to your business data.
- One engine for logs, traces, metrics and sessions: one database to run and back up.
2. Components and data flow #
Who does what.
Architecture #
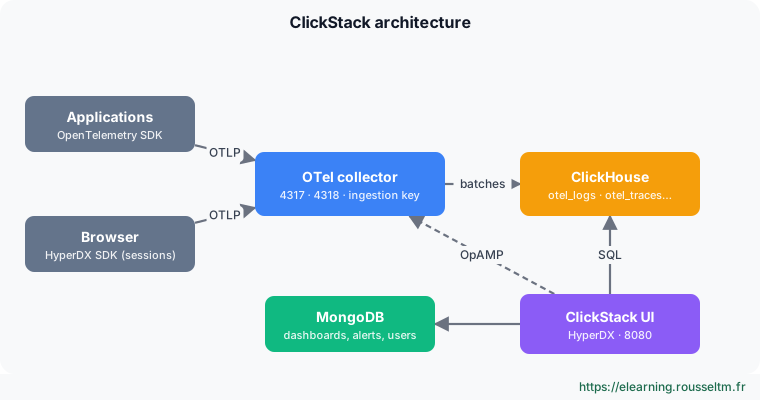
| Component | Role | Ports |
|---|---|---|
| OpenTelemetry collector (ClickStack distribution) | receives OTLP, checks the ingestion key, batches and writes into ClickHouse | 4317 (gRPC), 4318 (HTTP), 13133 (health), 8888 (metrics), 24225 (Fluentd) |
| ClickHouse | stores events in otel_logs, otel_traces, otel_metrics_*, hyperdx_sessions | 8123 (HTTP), 9000 (native) |
| ClickStack UI (HyperDX) | search, traces, sessions, dashboards, alerts; queries ClickHouse in SQL | 8080 (UI), 8000 (API), 4320 (OpAMP) |
| MongoDB | application state: users, dashboards, alerts, saved searches (not telemetry data) | 27017 |
An event's journey #
- The application sends a span or log line as OTLP to the collector, with the ingestion key in the
authorizationheader. - The collector batches events and inserts them into ClickHouse (large batches, as ClickHouse likes them).
- The UI translates a search (
level:err service:checkout) into an SQL query on the source table, and shows the result. - Dashboards and alerts are stored in MongoDB; alerts are evaluated periodically in SQL.
Good to know : The UI also drives the collector through OpAMP (port 4320): it supplies its configuration, hence the collector's OPAMP_SERVER_URL variable.3. Versions, licences and offerings #
What changed in 2026.
Landmarks #
- Images: published as
clickhouse/clickstack-*(all-in-one, collector…); the olddocker.hyperdx.io/hyperdx/…andghcr.io/hyperdxio/…names must be replaced. - Managed ClickStack (beta since February 2026): ClickHouse and the UI are hosted in ClickHouse Cloud, integrated with its console and access control; you only run the collector. No extra product to buy: billing follows ClickHouse Cloud infrastructure.
- Embedded UI: since ClickHouse 26.2, the ClickStack UI ships inside the ClickHouse binary, handy for local experiments.
- Licences: ClickHouse is Apache 2.0 licensed and the HyperDX UI is open source (MIT licence).
4. Strengths and limits #
Positioning it well.
Comparing #
| Aspect | ClickStack | Note |
|---|---|---|
| Storage cost | low (compression, object storage possible) | depends on chosen retention |
| Full-text search | fast on large volumes | “skip” indexes rather than inverted index |
| Correlation | logs, traces, metrics and sessions in one UI | requires propagated trace IDs |
| Operations | a ClickHouse database to size and monitor | except with Managed ClickStack |
| Ecosystem | younger than Grafana or Elastic | features evolving fast |
Commands to know #
Commands to know
docker run … clickhouse/clickstack-all-in-one:latest: whole stack in one containercurl http://localhost:13133: collector healthclickhouse-client --query "SHOW TABLES": tables created by the stackOTEL_EXPORTER_OTLP_HEADERS=authorization=<clé>: ingestion key for SDKs
Sources #
Checked in November 2026: ClickStack evolves fast (Managed ClickStack is in beta), check the ClickHouse documentation before relying on a detail.
My progress
Sign in to track your progress and take notes. Sign in
💬 Questions about this lesson
No questions yet: be the first to ask for help or share your configuration.
Recommended Articles
Telemetry in ClickHouse: schema, SQL, materialized views and retention
Telemetry in ClickHouse: otel_logs, otel_traces, otel_metrics_* and hyperdx_sessions tables, sort...
The observability trilemma: cost, completeness and performance, and how solutions resolve it
Understanding the observability trilemma (cost, data completeness, query performance), its three ...
OpenTelemetry architecture: understanding the 3 levels
A deep dive into the OpenTelemetry architecture. Learn how data flows from the application to the...
OpenTelemetry Collector, Grafana Alloy and Bindplane: comparing three approaches to telemetry pipelines
Detailed comparison of three ways to manage telemetry pipelines: the OpenTelemetry Collector in Y...
OpenTelemetry and Elasticsearch: compatibility and architecture
Send OpenTelemetry to Elasticsearch: Collector and elasticsearch exporter, managed OTLP endpoint,...
The LGTM stack (Loki, Grafana, Tempo, Mimir): architecture and setup
Grafana Labs' LGTM stack: Loki for logs, Grafana for visualization, Tempo for traces, Mimir for m...
Grafana Alloy vs OpenTelemetry Collector: Which One Should You Choose?
A detailed comparison between Grafana Alloy and the OpenTelemetry Collector. Discover the strengt...
Distributed tracing with Jaeger: concepts and architecture
The concepts of distributed tracing (trace, span, context, propagation) and Jaeger: its history, ...
OpenTelemetry (OTel) best practices: the guide to modern observability
Master OpenTelemetry with our expert advice: implementing the Collector, following semantic conve...