1. The trilemma in brief #
Three desired qualities, two at a time.
Definition #
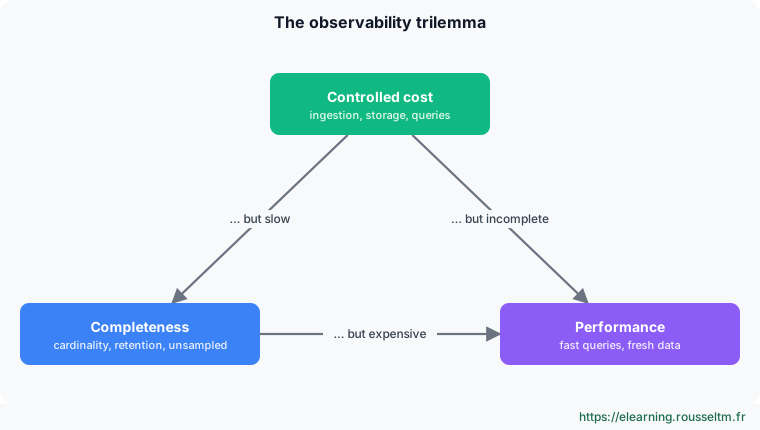
Every observability platform tries to offer three qualities: controlled cost, complete data (every dimension, over a long period, unsampled) and fast queries on fresh data. The observability trilemma states that as volume grows, you can only fully optimize two at a time: the third becomes the price to pay.
Where the idea comes from #
The idea was popularized in 2019 by Ben Sigelman (LightStep co-founder, formerly on Dapper at Google): among several desirable properties (high-cardinality queries, long retention, unsampled data…), you can only get some of them at once without costs exploding. Cindy Sridharan compared it to the CAP theorem of distributed systems. Since then, wording varies between authors, but the tension stays the same: cost, completeness, performance.
Good to know : The trilemma is not a law of physics: it is an economic constraint tied to storage and indexing. Technical progress (columnar storage, object storage) moves the boundary without removing it.
2. The three corners in detail #
What each word covers.
Cost #
Cost is not just the vendor's bill. You must count:
| Item | What drives it up |
|---|---|
| Ingestion | log volume, span count, number of metric series |
| Storage | retention, compression ratio, SSD or object storage, replication |
| Indexing | full inverted indexes, indexed fields, label cardinality |
| Queries | on-demand compute, data scanned, constantly refreshed dashboards, AI agents |
| Licences and billing model | per host, per GB ingested or indexed, per custom metric, per user |
| People | running the platform, upgrades, tuning |
Completeness #
- Cardinality: being able to filter by
user_id,pod,trace_id, version, customer… In a time-series system, every label combination creates a series: cardinality is expensive there. - Retention: keeping data long enough to compare with the previous week, month or year, and for audits.
- Fidelity: no sampling or aggregation that erases the rare event, precisely the one you look for during an incident.
- Coverage: every signal (metrics, logs, traces, profiles, sessions) and every service, not just the most critical ones.
Performance #
- Query latency: a few seconds at most during an incident, over large periods and volumes.
- Freshness: delay between emitting an event and seeing it (seconds, not minutes); essential for alerting.
- Concurrency: handling dozens of dashboards, continuously evaluated alerts and, more and more, AI agents firing hundreds of queries.
Best practice : Measure each corner with a number: cost per GB or per service per month, retention and sampling rate per signal, p95 of dashboard query duration. Without numbers, the trilemma is argued in opinions.
3. The three trade-offs #
Each pair has its price.
Overview #
| Chosen pair | Typical technique | Sacrifice | Example |
|---|---|---|---|
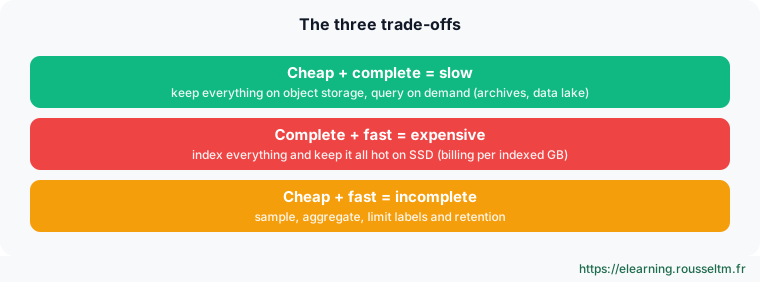
| Cost + completeness | keep everything, compressed, on object storage | slow or deferred queries | log archives on S3 queried with an on-demand SQL engine |
| Completeness + performance | full indexes, everything hot, generous resources | high cost | search cluster sized for 90 days of indexed logs |
| Cost + performance | sampling, aggregates, limited labels, short retention | incomplete data | Prometheus with 15 days retention and controlled labels; 1% of traces kept |
Real-life symptoms #
- “We do not have the trace for this request”: sampling discarded it (cost + performance).
- “Cannot filter by customer”: the label was removed to avoid series explosion (cost + performance).
- “The log bill doubled this quarter”: everything is indexed and kept hot (completeness + performance).
- “The 6-month query takes 20 minutes”: data is in the cold archive (cost + completeness).
Watch out : Blindly cutting the volume sent (“send less data”) means choosing incompleteness without saying so. Filtering is healthy, provided you know what you lose and decided it.
4. Why the trilemma is getting harder #
More data, more dimensions, more queries.
The causes #
- Volumes: microservices, Kubernetes and event-driven architectures multiply telemetry-emitting components; a single user request crosses dozens of services.
- Cardinality: ephemeral pods, container IDs, versions deployed several times a day, business attributes (customer, plan): combinations grow faster than traffic.
- New signals: continuous profiles, browser sessions, very large LLM application traces (prompts, tokens, evaluations).
- New consumers: AI investigation agents query telemetry far more often than humans, and need detailed, long-lived data to compare.
- Billing: per-GB or per-metric models turn every instrumentation decision into a budget decision.
5. Levers to loosen the grip #
Moving the boundary rather than enduring it.
The levers #
| Lever | Corner gained | Price paid |
|---|---|---|
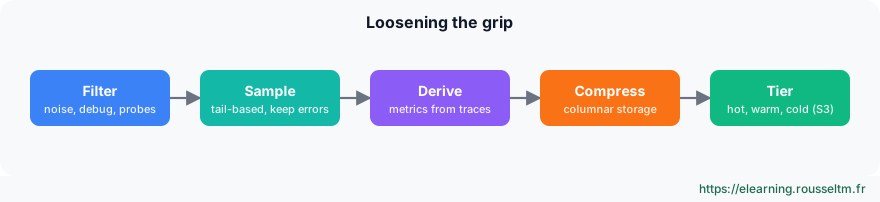
| Columnar storage and compression (ClickHouse, Parquet) | cost, without losing completeness | full-text search less precise than an inverted index |
| Separating compute and storage (object storage) | cost and long retention | latency on cold data |
| Minimal index (labels only, like Loki) | ingestion cost | slower “brute force” queries on large volumes |
| Hot / warm / cold tiers | cost, keeping performance on recent data | management complexity |
| Tail sampling | cost, keeping errors and slow traces | “normal” traces become statistical |
| Derived metrics (spanmetrics, logs to metrics) | dashboard performance and cost | dimensions fixed in advance |
| Adaptive aggregation (Adaptive Metrics/Logs, Chronosphere) | cost, guided by actual usage | depends on the tool's recommendations |
| Telemetry pipelines (OTel Collector, Bindplane, Cribl) | all three, by routing each piece of data to the right store | one more component to run |
Sampling without losing trends #
# OpenTelemetry collector: tail sampling (all errors, slow traces, 5% of the rest)
processors:
  tail_sampling:
    decision_wait: 10s
    num_traces: 100000
    policies:
      - { name: errors, type: status_code, status_code: { status_codes: [ERROR] } }
      - { name: slow,  type: latency,     latency: { threshold_ms: 1500 } }
      - { name: rest,   type: probabilistic, probabilistic: { sampling_percentage: 5 } }
connectors:
  spanmetrics:            # RED metrics computed on 100% of spans BEFORE sampling
    dimensions: [{ name: http.route }, { name: http.response.status_code }]
service:
  pipelines:
    traces/in:      { receivers: [otlp], processors: [memory_limiter], exporters: [spanmetrics, forward] }
    traces/sampled: { receivers: [forward], processors: [tail_sampling, batch], exporters: [otlphttp/traces] }
    metrics/red:    { receivers: [spanmetrics], processors: [batch], exporters: [prometheusremotewrite] }
RED metrics are computed on all spans, before sampling: dashboards stay exact, and only “ordinary” individual traces are dropped.
Routing by value #
# Route by value: hot logs without debug, everything in compressed archive
exporters:
  otlphttp/hot: { endpoint: https://logs-hot.interne:4318 }
  awss3/archive:
    s3uploader: { region: eu-west-3, s3_bucket: telemetry-archive, s3_prefix: logs }
    marshaler: otlp_proto
    compression: gzip
processors:
  filter/no-debug:
    logs:
      log_record: ['severity_number < SEVERITY_NUMBER_INFO']   # drops DEBUG and TRACE
service:
  pipelines:
    logs/hot:   { receivers: [otlp], processors: [filter/no-debug, batch], exporters: [otlphttp/hot] }
    logs/archive: { receivers: [otlp], processors: [batch], exporters: [awss3/archive] }
Best practice : Archiving 100% of raw logs on object storage costs little: you only pay the “hot” price for what daily investigations need, and you can rehydrate the archive if an audit requires it.
6. Comparing solutions: what each excels at #
None solves the trilemma; each picks its ground.
Positioning #
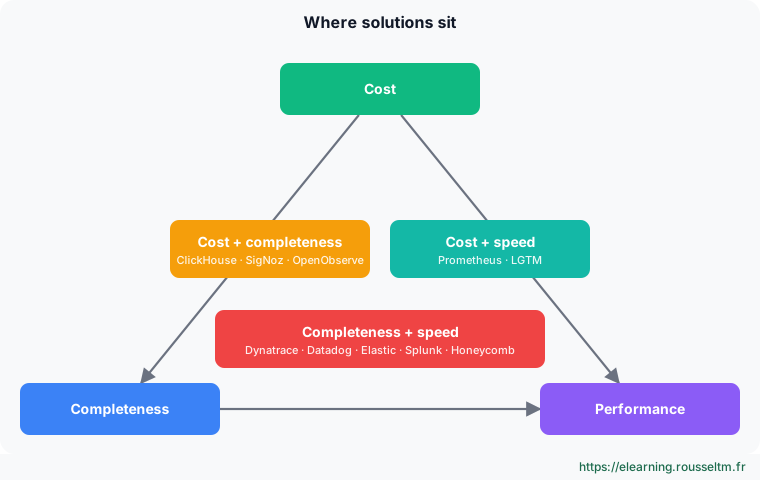
Each solution was born from an architecture choice that places it, by default, on one pair of the trilemma. All then offer options to fix their weak spot (cold tiers, sampling, aggregates), but their point of excellence stays tied to that initial choice.
What each one excels at #
| Solution | Architecture | Excels at | Watch point |
|---|---|---|---|
| ClickHouse (ClickStack, SigNoz) | columnar database, SQL, object storage possible | cost at high cardinality: strong compression, filters on any attribute, SQL analyses and joins with business data | a database to operate (unless managed), younger ecosystem |
| Dynatrace | single OneAgent, index-free Grail data lakehouse (schema on read), DQL language, Davis AI | automation and root-cause analysis: automatic discovery, Smartscape topology, AI-computed causality, little configuration | licence cost (consumption), strong dependency on the agent and platform |
| Datadog | unified SaaS, agent and 900+ integrations | functional breadth and time to value: APM, logs, RUM, security, synthetics in one very polished UI | hard-to-forecast bill (hosts, custom metrics, indexed logs); Flex Logs for long storage |
| LGTM (Loki, Grafana, Tempo, Mimir, Pyroscope) | specialized components on object storage, minimal index | storage cost and openness: cheap long retention, open source, Grafana federates dozens of sources | slower full-text and high-cardinality queries (Loki), several languages (PromQL, LogQL, TraceQL), several components to run |
| Elastic (Elasticsearch, Kibana) | inverted index, ES|QL, hot to frozen tiers (searchable snapshots), LogsDB mode | full-text search and log analytics: very fast ad hoc search, aggregations, and observability-security convergence (SIEM) | indexing and hot storage cost; index and tier tuning |
| Splunk | index and SPL language, schema on read | ad hoc investigation and security: very expressive SPL, mature SIEM ecosystem | cost at high volume |
| Honeycomb | wide events in columnar storage | high-cardinality exploration: slice by any field, BubbleUp to find what sets slow requests apart | focused on traces and events; less on infrastructure metrics |
| Prometheus | local time-series database, PromQL, pull model | real-time metrics and alerting: de facto standard, very fast, simple, free | limited cardinality and long retention: Mimir or Thanos to scale |
| OpenObserve | Rust, Parquet files on object storage, single binary | storage cost and simplicity: logs, metrics and traces in one light binary | younger project, smaller community |
Indicative grid #
| Solution | Cost | Completeness | Performance | Operational simplicity |
|---|---|---|---|---|
| ClickHouse (ClickStack, SigNoz) | ●●● | ●●● | ●●○ | ●●○ |
| Dynatrace | ●○○ | ●●● | ●●● | ●●● |
| Datadog | ●○○ | ●●○ | ●●● | ●●● |
| LGTM | ●●● | ●●○ | ●●○ | ●○○ |
| Elastic | ●●○ | ●●○ | ●●● | ●●○ |
| Splunk | ●○○ | ●●● | ●●● | ●●○ |
| Honeycomb | ●●○ | ●●● | ●●● | ●●● |
| Prometheus | ●●● | ●○○ | ●●● | ●●● |
| OpenObserve | ●●● | ●●○ | ●●○ | ●●● |
Watch out : Deliberately simplified grid, built in November 2026 for common uses: every offering evolves fast (cold tiers, adaptive aggregation, managed offerings), and results depend heavily on your volumes and settings. Always run a trial with your own data before deciding.
How each one fixes its weak spot #
- Elastic: frozen tier on searchable snapshots and LogsDB index mode (up to about 65% less storage according to Elastic) to cut cost.
- Datadog: Flex Logs and “Logging without Limits” separate ingestion, indexing and storage to keep data longer for less.
- Dynatrace: Grail removes indexing at ingestion (schema on read) to keep more data without preparing it.
- LGTM: blooms and structured metadata in Loki, Adaptive Metrics and Adaptive Logs in Grafana Cloud to cut volume and latency.
- ClickHouse: materialized views, skip indexes and managed offerings (Managed ClickStack) to gain performance and simplicity.
- Prometheus: Mimir or Thanos add object storage, high availability and long retention.
7. Choosing and arbitrating #
One pair per use case, not one for the whole company.
The method #
- Measure: volume per signal and per service, metric cardinality, actual query duration, current cost.
- Classify uses: alerting, incident investigation, dashboards, trend analysis, audit and compliance.
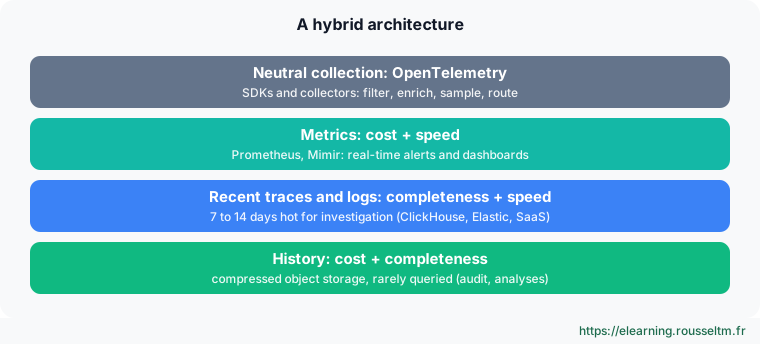
- Pick a pair per use (table below) rather than one platform for everything.
- Instrument with OpenTelemetry to route each signal to the right store and switch tools without re-instrumenting.
- Review quarterly: volume per service, unused labels, dashboards never opened, retention actually used.
A pair per use #
| Use | Pair to favour | Example implementation |
|---|---|---|
| Real-time alerting | cost + performance | Prometheus or Mimir metrics, controlled labels |
| Incident investigation (7 to 14 days) | completeness + performance | detailed traces and logs hot (ClickHouse, Elastic, SaaS) |
| Long-term dashboards | cost + performance | aggregates (materialized views, derived metrics) |
| Audit, compliance, one-off analyses | cost + completeness | compressed archive on object storage |
Measuring before deciding #
# Prometheus: the 10 metrics creating the most series
topk(10, count by (__name__) ({__name__=~".+"}))
# Prometheus: total active series
prometheus_tsdb_head_series

# Loki: labels blowing up the number of streams
logcli series '{namespace="prod"}' --analyze-labels

# ClickHouse: size and compression of telemetry tables
SELECT table, formatReadableSize(sum(data_compressed_bytes)) AS disk,
       round(sum(data_uncompressed_bytes) / sum(data_compressed_bytes), 1) AS ratio
FROM system.parts WHERE active GROUP BY table ORDER BY sum(data_compressed_bytes) DESC;

# Elasticsearch: largest indexes
GET _cat/indices?v&s=store.size:desc&h=index,docs.count,store.size

# Dynatrace (DQL): log volume per source over 24 h
fetch logs, from: now() - 24h | summarize n = count(), by: { log.source } | sort n desc
8. Key takeaways #
Summary and checklist.
Summary #
- The trilemma opposes cost, completeness and performance: as volume grows, you only optimize two at a time.
- Each solution excels on a pair tied to its architecture: ClickHouse on cost and cardinality, Dynatrace on automation, Datadog on functional breadth, LGTM on storage cost and openness, Elastic on full-text search, Prometheus on real-time metrics.
- The best answer is rarely a single tool: it is an architecture per use, fed by OpenTelemetry and pipelines routing each piece of data to the right trade-off.
Checklist #
| Question | Good answer |
|---|---|
| Do you know your cost per service? | yes, reviewed monthly |
| Does sampling keep every error? | yes, tail sampling and metrics computed before |
| Is retention defined per signal? | yes, and aligned with actual use |
| Are high-cardinality labels under control? | in metrics, yes; in traces and logs, they are allowed |
| Can you switch tools without re-instrumenting? | yes, thanks to OpenTelemetry |
Commands to know #
Commands to know
topk(10, count by (__name__) ({__name__=~".+"})): metrics creating the most serieslogcli series '{namespace="prod"}' --analyze-labels: Loki label cardinalitySELECT … FROM system.parts WHERE active: ClickHouse size and compressionGET _cat/indices?v&s=store.size:desc: heaviest Elasticsearch indexestail_sampling (OTel Collector): sample while keeping errors and slow tracesspanmetrics (OTel Collector): exact RED metrics despite sampling
Sources #
- InfoQ: Rethinking Observability (Ben Sigelman, 2019)
- ClickHouse: retention, sampling and rollups (2026)
- DevOps.com: “send less data” is not a strategy
- OpenTelemetry: tail_sampling processor
- Dynatrace Grail
- Datadog Flex Logs
- Grafana Loki: minimal index design
Checked in November 2026: offerings and billing models change fast, check each vendor's documentation before relying on a detail.
Keep learning
 Dynatrace: From Discovery to Expertise
 Prometheus: From Discovery to Expertise
 OpenTelemetry: From Discovery to Expertise
 Grafana: From Discovery to Expertise
 Kibana and Elastic Observability: from discovery to expertise
 SigNoz: from discovery to expertise
 Datadog: from discovery to expertise
 Bindplane: OpenTelemetry telemetry pipelines from discovery to expertise
 ClickStack: from discovery to expertise
 OpenObserve: from discovery to expertise