1. Recap: SLI, SLO and error budget #
The vocabulary shared by both methods.
The concepts #
| Term | Definition | Example |
|---|---|---|
| SLI | measured indicator of service quality | share of payments accepted in under 2 s |
| SLO | target set on that SLI, over a window | 99.9% over a rolling 30 days |
| SLA | contractual commitment, with penalties | 99.5% per month, otherwise credit |
| Error budget | what you allow yourself to miss: 100% − SLO | 0.1% of minutes or requests |
| Burn rate | speed of budget consumption (1 = the budget lasts exactly the window) | 14.4: 30-day budget exhausted in 2 days |
Everything rests on one simple question: what do we count? Either time slices (“how many minutes was the service good?”) or events (“how many requests were served well?”). That is the whole difference between the two SLO families.
Good to know : For the basics, see SLI, SLO and SLA explained simply and The error budget.
2. The time-based SLO #
Time slices, or the uptime logic.
Principle #
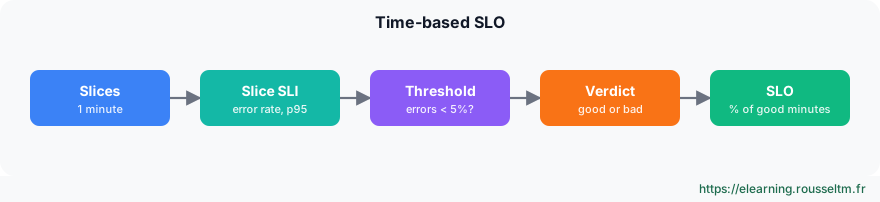
The window is cut into slices (often one minute). For each slice, an SLI is computed (error rate, p95 latency, probe response) and the slice is declared good or bad against a threshold. The SLO is about the share of good slices. It is the historical “uptime” logic and that of most contractual SLAs.
SLI = good minutes / minutes in the window
good minute  ⇔  minute error rate < 5%  AND  minute p95 < 500 ms

30 days = 43,200 minutes; 99.9% SLO  ⇒  budget = 43.2 bad minutes
The “nines” table #
| SLO | Budget over 30 days | Budget over 90 days | Budget over 1 year |
|---|---|---|---|
| 99% | 7 h 12 min | 21 h 36 min | 3 d 15 h 36 min |
| 99.5% | 3 h 36 min | 10 h 48 min | 1 d 19 h 48 min |
| 99.9% | 43 min 12 s | 2 h 9 min 36 s | 8 h 45 min 36 s |
| 99.95% | 21 min 36 s | 1 h 4 min 48 s | 4 h 22 min 48 s |
| 99.99% | 4 min 19 s | 12 min 58 s | 52 min 34 s |
Strengths and weaknesses #
| Strengths | Weaknesses |
|---|---|
| intuitive: “the service was down for 12 minutes” | arbitrary binary threshold: 4.9% errors = perfect minute, 5.1% = lost minute |
| works with little or no traffic (synthetic probes) | ignores partial degradations below the threshold, even long ones |
| aligned with contractual SLAs expressed in minutes | a night minute weighs as much as a peak minute |
| robust against one client's traffic spikes | sensitive to slice size and probe frequency |
3. The event-based SLO #
Request-based, or the user experience logic.
Principle #
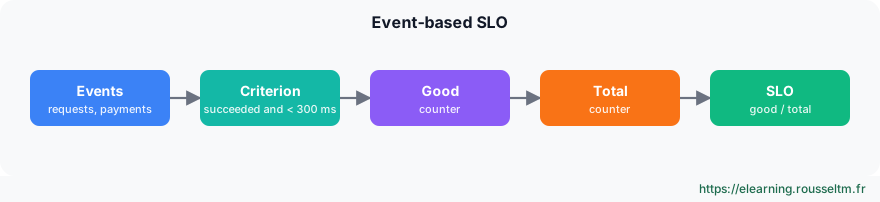
You count events (HTTP requests, payments, logins, processed messages) and classify each as good or bad against a criterion: succeeded, and possibly fast enough. The SLI is the good / total ratio over the window. The error budget is expressed as a number of failed events.
SLI = good events / total events
good  ⇔  status ≠ 5xx  AND  duration < 300 ms

30 million requests per month; 99.9% SLO  ⇒  budget = 30,000 failed requests
Strengths and weaknesses #
| Strengths | Weaknesses |
|---|---|
| proportional to users affected: a peak outage costs more than a night outage | low traffic = noise: 1 error in 20 requests drops the SLI to 95% |
| captures partial degradations: 2% errors for hours really consume budget | requests that never arrived are not counted when measured server-side |
| no arbitrary per-slice threshold | a night outage weighs little, even if it blocks critical customers |
| natural burn rate and precise multi-window alerts | sensitive to retries and to how an event is defined |
Good to know : Google SRE recommends event-based SLIs (“proportion of good events”) by default for services with enough traffic, and keeps time slices for low or irregular traffic.
4. The same month, measured both ways #
Three incidents telling two stories.
Assumptions #
- Payment API, about 30 million requests per month: 100 requests per minute at night, 1,000 during the day, 3,000 at peak.
- 99.9% SLO over 30 days: budget of 43.2 minutes (time) or 30,000 requests (events).
- Time side: a minute is bad if more than 5% of requests fail.
Results #
| Incident | Time: minutes lost | Time: budget | Events: failed requests | Events: budget |
|---|---|---|---|---|
| A. Full outage for 30 min at 3 a.m. | 30 | 69% | 3,000 | 10% |
| B. 4% errors for 10 h during the day | 0 | 0% | 24,000 | 80% |
| C. Full outage for 20 min at peak hour | 20 | 46% | 60,000 | 200% |
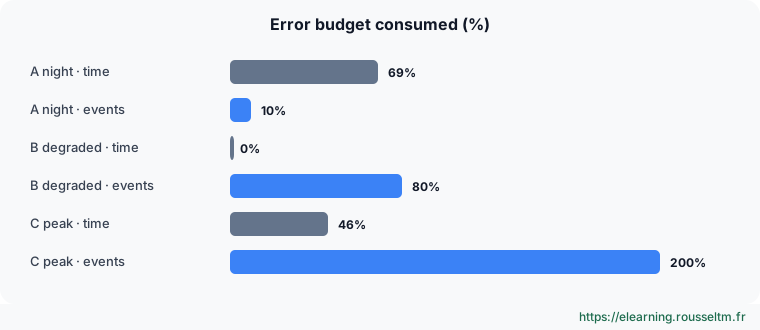
What it shows #
- Incident A: the time SLO raises the alarm (69% of budget) for an outage that hit very few customers; the event SLO puts it in perspective (10%).
- Incident B: invisible to the time SLO (always below the 5% threshold), while 24,000 payments failed. The event SLO makes it the major incident of the month.
- Incident C: the time SLO rates it less serious than A; the event SLO shows it alone exhausted the budget twice.
Best practice : Neither measure is “wrong”: they answer different questions. Time answers “how long was the service usable?”, events answer “what share of users were served well?”.
5. Implementing #
Prometheus, OpenSLO, SQL and market tools.
With Prometheus #
# Events: SLI = good requests / total requests (recording rules)
groups:
  - name: slo-payment
    rules:
      - record: sli:payment:ratio_rate5m
        expr: |
          sum(rate(http_requests_total{service="payment", code!~"5.."}[5m]))
          /
          sum(rate(http_requests_total{service="payment"}[5m]))
      # Burn rate over 1 h and 5 min: page if the 30-day budget burns 14.4 times too fast
      - alert: PaymentBudgetBurn
        expr: |
          (1 - sli:payment:ratio_rate1h) > (14.4 * 0.001)
          and
          (1 - sli:payment:ratio_rate5m) > (14.4 * 0.001)
        labels: { severity: page }

# Time: share of “good” minutes over 30 days (subquery, 1 min resolution)
avg_over_time(
  (
    (sum(rate(http_requests_total{service="payment", code=~"5.."}[1m]))
      / sum(rate(http_requests_total{service="payment"}[1m]))) < bool 0.05
  )[30d:1m]
)
On the event side, two counters are enough. On the time side, the [30d:1m] subquery evaluates each minute then averages the verdicts (1 or 0): expensive over 30 days, it is better computed with a per-minute recording rule.
To generate rules and alerts automatically, see Sloth and Pyrra.
With OpenSLO #
# OpenSLO v1: same target, two budgeting methods
apiVersion: openslo/v1
kind: SLO
metadata: { name: payment-evenements }
spec:
  service: payment
  budgetingMethod: Occurrences          # event-based
  objectives:
    - target: 0.999
  timeWindow: [{ duration: 30d, isRolling: true }]
  indicator:
    metadata: { name: payment-succes }
    spec:
      ratioMetric:
        good:  { metricSource: { type: Prometheus, spec: { query: 'sum(rate(http_requests_total{service="payment",code!~"5.."}[1m]))' } } }
        total: { metricSource: { type: Prometheus, spec: { query: 'sum(rate(http_requests_total{service="payment"}[1m]))' } } }
---
# Time variant: each minute is good if its ratio exceeds 95%
#   budgetingMethod: Timeslices
#   objectives: [{ target: 0.999, timeSliceTarget: 0.95, timeSliceWindow: 1m }]
The OpenSLO specification explicitly names both methods: Occurrences (events) and Timeslices (time), with a per-slice threshold (timeSliceTarget).
In SQL on traces #
-- Events from traces (ClickHouse, otel_traces table): SLI per day
SELECT toDate(Timestamp) AS day,
       countIf(StatusCode != 'Error' AND Duration < 300e6) / count() AS sli
FROM otel_traces
WHERE ServiceName = 'payment' AND SpanKind = 'Server' AND Timestamp > now() - INTERVAL 30 DAY
GROUP BY day ORDER BY day;

-- Time: share of minutes where the error rate stays below 5%
SELECT avg(rate < 0.05) AS sli_time FROM (
  SELECT toStartOfMinute(Timestamp) AS m, countIf(StatusCode = 'Error') / count() AS rate
  FROM otel_traces
  WHERE ServiceName = 'payment' AND SpanKind = 'Server' AND Timestamp > now() - INTERVAL 30 DAY
  GROUP BY m);
In tools #
| Tool | Events | Time |
|---|---|---|
| Grafana SLO | ratio of two queries | via a slice query |
| Datadog | “metric-based” SLO | “monitor-based” and “time slice” SLOs |
| Dynatrace | SLO on metric or DQL ratio | SLO on synthetic availability |
| Nobl9, Sloth, Pyrra | yes (default method) | Nobl9: yes; Sloth and Pyrra: event-oriented |
Watch out : Labels and options change: check your tool's documentation, especially how it treats slices with no traffic (good, bad or ignored).
6. The Qonto example #
A status page expressed per customer journey.
What the status page shows #
The neobank Qonto moved to an event-based approach to express its reliability. Its public status page (status.qonto.com) shows availability per component, over a 90-day window, with four decimals. Components map to customer journeys rather than servers:
| Component | Displayed availability (90 days, November 2026 reading) | Event reading | Time reading (equivalent) |
|---|---|---|---|
| Authentication | 99.9969% | ≈ 3 failures per 100,000 logins | ≈ 4 min over 90 days |
| Transactions | 99.9713% | ≈ 29 failures per 100,000 operations | ≈ 37 min over 90 days |
| Card payments | 99.9992% | ≈ 8 failures per million payments | ≈ 1 min over 90 days |
| Transfers | 99.9969% | ≈ 3 failures per 100,000 transfers | ≈ 4 min over 90 days |
Figures are rolling and change daily; the “time reading” column only shows what the same percentage would mean if expressed in minutes.
Why this choice suits a bank #
- Every event is a customer: a card payment wrongly declined is visible at the till, whatever the time. Counting failed payments directly reflects customer impact.
- Partial degradations count: 1% of failed transfers during a morning is not an “outage” in uptime terms, but it is an incident for the customers involved (incident B in section 4).
- Volume allows it: with millions of operations, the ratio is stable and precise, hence the value of four decimals.
- Journeys rather than technical components: customers see “Card payments”, not “Kafka cluster”; each journey has its own SLO and budget.
- A 90-day window smooths variations without hiding trends, and matches a quarterly steering horizon.
Takeaways for your own status page #
- Split by customer journey (sign in, pay, transfer), each with its event SLI.
- Measure as close to the user as possible (load balancer, gateway, client) to also count requests that never reach the service.
- Show a rolling window and a precision consistent with volume.
- Publicly explain the method (what a “good” event is): transparency builds trust.
- Keep UP, DEGRADED, DOWN and MAINTENANCE states for the present moment, and the percentage for history.
Good to know : Qonto does not publish the details of its calculation on this page (definition of a successful event, measurement point): the “≈ N failures” readings above are an arithmetic conversion of the displayed percentage, not figures communicated by Qonto.
7. Choosing, or combining #
Depending on traffic, contract and the question asked.
Decision grid #
| Situation | Recommended method | Why |
|---|---|---|
| High-traffic API or journey (payments, search, login) | events | reflects the share of customers affected, captures partial degradations |
| Low-traffic service (back office, rarely called B2B API) | time (with synthetic probes) | avoids a single error crashing the SLI |
| Contractual SLA in minutes | time for the SLA, events for internal steering | the contract imposes the unit |
| Batch jobs, scheduled tasks | events (successful on-time runs) | each run is an event |
| Very irregular traffic (seasonal peaks) | events, complemented by probes | peaks count more, troughs stay watched |
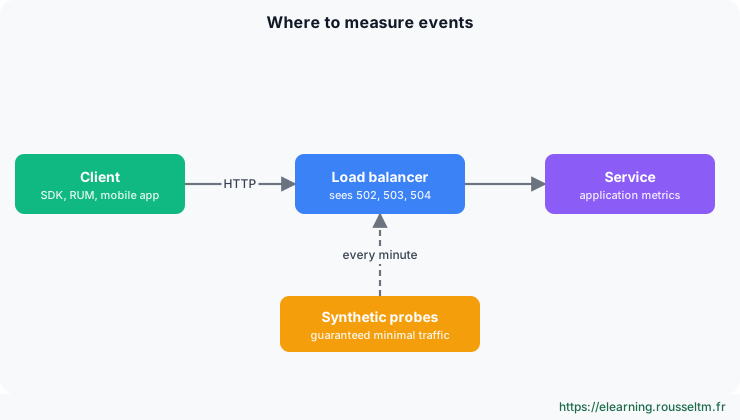
Combining both #
- Events + probes: synthetic probes guarantee minimal traffic, so a full night-time outage still consumes budget.
- Minimum traffic threshold: only count a window if it holds enough events, or aggregate over a longer window.
- Multiple SLOs: an event SLO for perceived quality and a time SLO for contractual availability, shown side by side.
8. Common pitfalls #
What skews an SLO, whatever the method.
The pitfalls #
| Pitfall | Effect | Fix |
|---|---|---|
| Measuring server-side only | a load balancer or DNS outage is not counted (zero events) | measure at the load balancer or client, add probes |
| Counting retries | one user request becomes three events | count the business operation, not the HTTP call |
| Counting 4xx as errors | client errors consume your budget | exclude 4xx, except 429 and 408 if they are your limits |
| Poorly chosen slice threshold | invisible degradations or excessive alerts | base the threshold on history, review it |
| Maintenance excluded without a rule | flattering SLO, loss of trust | written, public exclusion rule |
| Single global SLO | one large customer down disappears in the average | SLO per journey, even per customer segment |
Best practice : Write the SLI definition like a contract: what an event is, what makes it good, where it is measured, what is excluded. That document, more than the tool, makes the SLO credible.
9. Key takeaways #
Summary, commands and sources.
Summary #
| Time-based SLO | Event-based SLO | |
|---|---|---|
| You count | good time slices | good events |
| Budget expressed in | minutes | failed events |
| Question asked | how long was the service usable? | what share of users was served well? |
| Ideal for | low traffic, contractual SLAs | high traffic, customer experience, steering |
| Blind spot | partial degradations, traffic weight | low traffic, requests never received |
Commands to know #
Commands to know
sum(rate(http_requests_total{code!~"5.."}[5m])) / sum(rate(http_requests_total[5m])): event-based SLI (PromQL)avg_over_time((… < bool 0.05)[30d:1m]): time-slice SLI (PromQL)(1 - sli:ratio_rate1h) > 14.4 * 0.001: fast burn rate alertbudgetingMethod: Occurrences | Timeslices: choose the method in OpenSLOsloth generate -i slo.yaml: generate Prometheus rules and alerts
Sources #
- Google SRE Workbook: Implementing SLOs
- Google SRE Workbook: Alerting on SLOs (burn rate)
- OpenSLO specification (Occurrences, Timeslices)
- Datadog: SLO types
- Qonto status page
Qonto status page reading taken in November 2026; percentages change daily.


