1. Visualizing states #
State timeline, Status history and Node graph.
Three visualizations to know #
Available in: ✓ OSS ✓ Enterprise ✓ Cloud
| Visualization | Shows | Example |
|---|---|---|
| State timeline | a series' state changes over time, as coloured bands | availability of each service, circuit breaker state |
| Status history | a grid of cells: one row per series, one cell per interval | probe status per hour, backup results |
| Node graph | nodes and directed edges, with their statistics | service dependencies (service graph) |
State timeline #
# State timeline: state of each target over time (1 = up, 0 = down)
up{job=~"api|db|cache"}
# Then in the panel options: Value mappings 1 -> “OK” (green), 0 -> “KO” (red)
Best practice : Value mappings and thresholds make it readable: a clear state beats a line between 0 and 1.
Node graph #
# Node graph: the panel expects two tables, “nodes” (id, title, mainstat…) and “edges” (id, source, target).
# The simplest source: Tempo's service graph (“Service Graph” tab in Explore),
# fed by Tempo's metrics-generator or by Grafana Alloy (otelcol.connector.servicegraph).
2. Annotations #
Showing events on graphs.
Three annotation sources #
- Manual: Ctrl + click (or Cmd + click) on a graph to record an event.
- Queries: in dashboard settings, a query returning events (Prometheus alerts, deployments in Loki, rows from a SQL table).
- API: your CI publishes each deployment; you immediately see whether a degradation follows a release.
From a pipeline #
# Create an annotation from a deployment pipeline (service account token)
curl -s -H "Authorization: Bearer $TOKEN" -H 'Content-Type: application/json' -X POST $GRAFANA/api/annotations \
  -d '{"tags":["deployment","api"],"text":"api v2.4.1 deployed by GitLab CI"}'
3. Reuse: library panels and repeats #
Stop copy-pasting panels.
Library panels #
A library panel is stored in a folder and inserted into several dashboards: editing it once updates every dashboard that uses it. Ideal for “Service availability” or “5xx errors” shown the same way everywhere. Its permissions follow its folder's.
Repeated panels and rows #
In Panel options › Repeat options, choose a multi-value variable: Grafana creates one panel per value (horizontally or vertically, with a maximum per row). A repeated row or tab duplicates a whole group of panels, for example a full block per server.
Watch out : A repeat over a 200-value variable creates 200 panels and as many queries: limit the values selected by default.
Advanced variables #
Chained variables, variables shared across dashboards or specific to a row are covered in the “Variables and constants” chapter of this course.
4. Navigating: data links and dashboard links #
From overview to detail in one click.
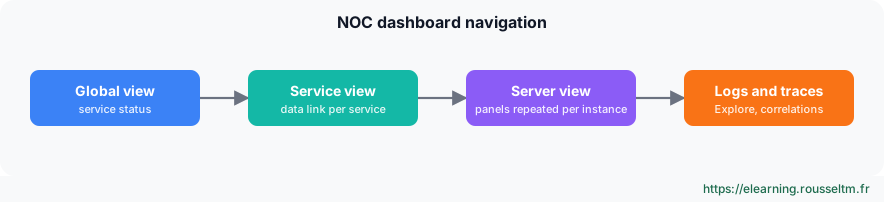
The NOC journey #
Data links #
A data link is attached to a value: clicking the “payment” service bar opens that service's dashboard, over the same time range. The ${__field.labels.xxx}, ${__value.raw}, ${__url_time_range} and ${__all_variables} variables carry the context.
# Data link from a “global view” panel to a service dashboard
/d/service-detail/service?var-service=${__field.labels.service}&${__url_time_range}
# To a server dashboard, keeping current variables
/d/server-detail/server?var-instance=${__field.labels.instance}&${__all_variables}&${__url_time_range}
Dashboard links #
In dashboard settings, links show shortcuts to other dashboards at the top of the page: by tag (every dashboard tagged noc, as a dropdown) or by URL. Tick “Include current time range” and “Include current template variable values” to keep context.
5. Dynamic text #
A text panel that follows variables.
The Text panel #
The native Text panel renders Markdown and replaces variables: service header, links to the runbook or ticket, displayed time range. For content computed from data (Handlebars templates), community plugins exist; check their maintenance and signature before adopting them.
## Service ${service}
Environment : **${env}** · time range : ${__from:date:YYYY-MM-DD HH:mm} → ${__to:date:YYYY-MM-DD HH:mm}

[Open the runbook](https://wiki.exemple.fr/runbooks/${service})
Commands to know #
Commands to know
${__field.labels.instance}: label value of the clicked series (data link)${__url_time_range}: current time range to pass in a link${__all_variables}: every dashboard variable in a link${var:queryparam}: variable as a URL parameter (var-x=…)POST /api/annotations: publish an event (deployment, incident)GET /api/library-elements: list library panels
