1. Health and internal metrics #
Using Grafana is not enough: you have to operate it.
The endpoints #
Available in: ✓ OSS ✓ Enterprise ✕ Cloud Grafana Cloud is operated by Grafana Labs
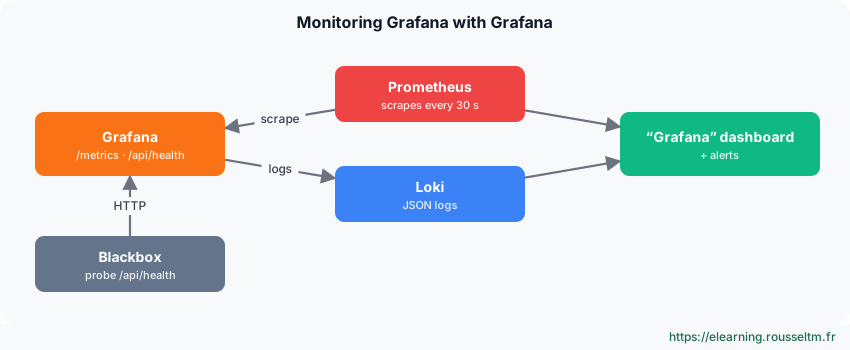
curl -s https://grafana.exemple.fr/api/health
# {"database":"ok","version":"13.x","commit":"…"}   -> 200 when the database answers, 503 otherwise
curl -s https://grafana.exemple.fr/metrics | grep -E '^grafana_(build_info|http_request_duration_seconds_count)' | head
Scraping with Prometheus #
# prometheus.yml
scrape_configs:
  - job_name: grafana
    metrics_path: /metrics
    static_configs: [{ targets: ["grafana:3000"] }]
# grafana.ini: protect /metrics with basic authentication
[metrics]
enabled = true
basic_auth_username = prometheus
basic_auth_password = $__file{/run/secrets/metrics_password}
Useful queries #
# p95 latency of Grafana's HTTP requests, per route
histogram_quantile(0.95, sum by (le, handler) (rate(grafana_http_request_duration_seconds_bucket[5m])))
# Rate of 5xx errors returned by Grafana
sum(rate(grafana_http_request_duration_seconds_count{status_code=~"5.."}[5m]))
# p95 duration of requests to each data source
histogram_quantile(0.95, sum by (le, datasource) (rate(grafana_datasource_request_duration_seconds_bucket[5m])))
Best practice : Alert on /api/health (blackbox probe), on the 5xx rate and on data source latency: they are the three main causes of a “slow” Grafana.2. Logs and slow queries #
Reading what Grafana says.
Configuring logs #
# grafana.ini: JSON logs, easy to ship to Loki
[log]
mode = console
level = info
[log.console]
format = json
# Find slow HTTP requests (duration field of “Request Completed” lines)
docker logs grafana 2>&1 | grep 'Request Completed' | jq -r 'select(.duration | test("^[0-9.]+s$")) | "\(.duration) \(.path)"' | sort -rn | head
Reading a slow dashboard #
- Open the panel's query inspector (Inspect › Query): duration, number of series and response size.
- A panel returning thousands of series is too broad: aggregate in the query (
sum by) rather than with a transformation. - Set the minimum interval and Max data points: no point asking for one point per second over seven days.
- Limit panels visible on load: collapsed rows only run their queries once expanded.
3. Performance and caching #
Fewer queries, less load on data sources.
Levers #
- Query caching (Enterprise, Cloud): reuses results of the same query for a duration set per data source.
- Refresh: avoid 5 s on a 40-panel wall screen; set
min_refresh_intervalingrafana.ini. - Timeouts:
[dataproxy] timeoutcuts overly long data source requests instead of blocking users. - Recording: a Prometheus recording rule precomputes a heavy query used by many panels.
4. Plugins, backups and troubleshooting #
Everyday operations.
Plugins and versions #
Pin each plugin version (GF_PLUGINS_PREINSTALL=grafana-clock-panel@<version> or grafana cli plugins install <id> <version>), test them in DEV before any Grafana upgrade, and refuse unsigned plugins in production. Since Grafana 12, AngularJS plugins no longer load.
Backup and restore #
# SQLite (single instance): consistent hot copy
sqlite3 /var/lib/grafana/grafana.db ".backup '/backup/grafana-$(date +%F).db'"
# PostgreSQL (multiple instances)
pg_dump -Fc -h db.exemple.fr -U grafana grafana > /backup/grafana-$(date +%F).dump
# Also back up: grafana.ini, provisioning/, the secret_key, the plugin list and versions
grafana cli plugins ls > /backup/plugins-$(date +%F).txt
Watch out : A restore without the same secret_key makes data source passwords unreadable. Test restoring onto a spare instance at least once a quarter.Troubleshooting a data source #
- “Save & test” on the data source page: the error message often gives the cause (DNS, certificate, authentication).
- Test from the Grafana server or container, not from your laptop:
curl -v https://prometheus:9090/-/ready. - Look in Grafana logs for lines about that data source (UID or type), with the returned HTTP status.
- Check the access mode: with Server (default), the Grafana server reaches the source.
Commands to know #
Commands to know
curl /api/health: status of Grafana and its databasecurl /metrics: internal metrics in Prometheus formatgrafana cli plugins ls: installed plugins and versionsgrafana cli plugins update-all: update plugins (after testing)sqlite3 grafana.db ".backup …": hot backup of an SQLite databasepg_dump -Fc grafana: back up the PostgreSQL database
