1. Grafana's HTTP API #
Everything the UI does is available through the API.
Authentication #
Available in: ✓ OSS ✓ Enterprise ✓ Cloud
Each call carries a service account token: Authorization: Bearer glsa_…. The service account role limits what the script can do.
The most useful calls #
export GRAFANA=https://grafana-dev.exemple.fr TOKEN=glsa_xxx
H=(-H "Authorization: Bearer $TOKEN" -H 'Content-Type: application/json')
curl -s "${H[@]}" "$GRAFANA/api/search?type=dash-db&query=api" | jq -r '.[] | "\(.uid)  \(.title)"'   # search
curl -s "${H[@]}" $GRAFANA/api/dashboards/uid/api-overview | jq '.dashboard' > api-overview.json  # export
# import (create or update) into a folder, with a history message
jq -n --slurpfile d api-overview.json '{dashboard: ($d[0] | .id = null), folderUid: "prod", overwrite: true, message: "import CI"}' \
  | curl -s "${H[@]}" -X POST $GRAFANA/api/dashboards/db -d @-
curl -s "${H[@]}" $GRAFANA/api/datasources | jq -r '.[] | "\(.uid) \(.type) \(.name)"'        # data sources
curl -s "${H[@]}" $GRAFANA/api/dashboards/uid/api-overview/versions | jq '.[0:3]'              # history
Good to know : Grafana 12 and 13 also expose dashboards and folders through new Kubernetes-style APIs (/apis/dashboard.grafana.app/…), used by Git Sync and the new command-line tool. The classic/api/…APIs remain available.
2. Terraform #
Describing Grafana as infrastructure.
The grafana/grafana provider #
The official Terraform provider manages folders, dashboards, data sources, teams, permissions, service accounts, alert rules and contact points, for Grafana OSS, Enterprise and Cloud.
terraform {
  required_providers {
    grafana = { source = "grafana/grafana" }
  }
}
provider "grafana" {
  url  = var.grafana_url
  auth = var.grafana_token          # service account token, supplied by TF_VAR_grafana_token
}
resource "grafana_folder" "prod" {
  title = "Production"
}
resource "grafana_team" "prod" {
  name = "Production"
}
resource "grafana_folder_permission" "prod" {
  folder_uid = grafana_folder.prod.uid
  permissions {
    team_id    = grafana_team.prod.id
    permission = "Edit"
  }
}
resource "grafana_data_source" "prometheus" {
  type = "prometheus"
  name = "Prometheus"
  url  = var.prometheus_url
}
resource "grafana_dashboard" "api" {
  folder      = grafana_folder.prod.uid
  config_json = file("${path.module}/dashboards/api-overview.json")
}
Several environments #
# One codebase, one variable file per environment
terraform workspace select dev   || terraform workspace new dev
terraform apply -var-file=env/dev.tfvars
terraform workspace select prod  || terraform workspace new prod
terraform plan  -var-file=env/prod.tfvars -out=prod.plan   # reviewed and approved in the merge request
terraform apply prod.plan
Secrets in deployments #
- Tokens and passwords go through environment variables (
TF_VAR_…) fed by the CI vault or Vault, never through versioned.tfvarsfiles. - The Terraform state file contains secrets: store it in an encrypted remote backend with restricted access.
- Data sources differ per environment: in dashboard JSON, use a data source variable rather than a fixed UID.
3. Dashboard lifecycle #
Git, review, validation and promotion.
The pipeline #
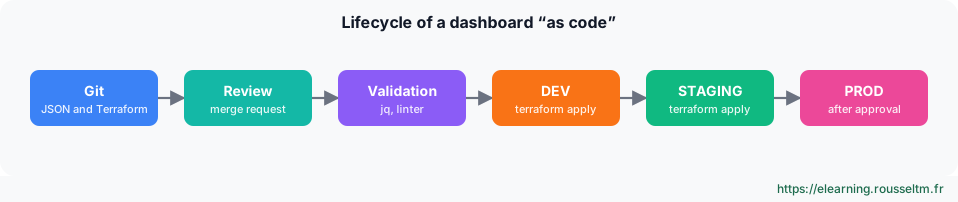
Testing before deploying #
# Quick validation in CI before any deployment
for f in dashboards/*.json; do
  jq empty "$f" || exit 1                                          # valid JSON
  jq -e '.uid and .title' "$f" >/dev/null || { echo "$f: missing uid or title"; exit 1; }
  jq -e '[.. | .datasource? | objects | select(.uid != null and (.uid | startswith("${") | not))] | length == 0' "$f" >/dev/null \
    || echo "$f: hard-coded data source (use a variable)"
done
terraform fmt -check && terraform validate
Complete with dashboard-linter (a Grafana project) for query best practices, and an acceptance dashboard deployed to DEV and checked before promotion.
Which tool for which need? #
| Tool | Strength |
|---|---|
| File provisioning | simple, at Grafana startup; read-only dashboards |
| Git Sync | two-way sync with a repository, edit from the UI then pull request |
| Terraform | all of Grafana (permissions, teams, alerts) with plan and state |
| HTTP API and scripts | migrations, bulk exports, in-house tools |
Commands to know #
Commands to know
GET /api/search?type=dash-db: search dashboardsGET /api/dashboards/uid/:uid: export a dashboardPOST /api/dashboards/db: create or update a dashboardGET /api/dashboards/uid/:uid/versions: a dashboard's historyterraform plan -var-file=env/prod.tfvars: preview production changesterraform import grafana_dashboard.api <uid>: bring an existing dashboard under Terraform
