1. Sources #
What the UI queries.
The principle #
Available in: ✓ Open source ✓ Managed ClickStack
A source describes a ClickHouse table and how to read it: time column, message body, level, service name, trace IDs. ClickStack creates default sources with the first account; you can add more for any ClickHouse table, including your own data.
| Source | Table | Use |
|---|---|---|
| Logs | otel_logs | search, live tail, charts |
| Traces | otel_traces | span search, waterfall, latency |
| Metrics | otel_metrics_gauge, _sum, _histogram… | charts and dashboards |
| Sessions | hyperdx_sessions | browser session replay |
Best practice : Link sources together (logs ↔ traces ↔ sessions) in their settings: that is what enables correlation links in the UI.
2. Searching #
Properties, full text or SQL.
Search syntax #
| Search | Finds |
|---|---|
timeout | events whose body contains “timeout” |
"connection refused" | the exact phrase |
level:err | error level (property) |
service:checkout level:err | both conditions (implicit AND) |
service:checkout OR service:payments | either one |
-level:info / NOT level:info | exclude |
http.status_code:500 | an attribute (Map column key) |
The SQL mode accepts a WHERE condition directly: SeverityText = 'error' AND LogAttributes['http.route'] LIKE '/api/%'. Handy for ClickHouse functions (regular expressions, numeric comparisons).
Exploring results #
- Live tail: new events stream in during a release or a test.
- Histogram of event counts over time: click and drag to zoom into a spike.
- Columns: add an attribute as a column, filter on a value in one click from an event's details.
- Saved searches: reusable, shareable, and the basis of alerts.
3. Traces, logs and sessions #
Correlating signals.
The journey #
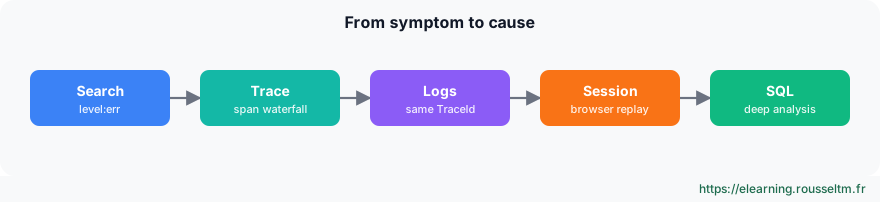
- Trace: the waterfall shows each span, its duration and attributes; logs emitted during each span are shown alongside.
- From log to trace: a log carrying a
TraceIdopens the full request trace. - From trace to session: if the browser SDK is in place, the user's session, journey and replay.
A typical investigation #
- An alert reports errors: search
service:checkout level:errover the last hour. - The histogram shows when it started; a log's details give the faulty
http.routeattribute. - Open the trace: the longest span is a database call timing out.
- The session shows the user's action and the error message displayed.
- Measure the scope in SQL (number of users affected) before communicating.
4. Going further with SQL #
When the UI is not enough.
Useful queries #
-- Distinct users affected by the error over the last hour
SELECT uniq(LogAttributes['user.id']) AS users
FROM otel_logs
WHERE ServiceName = 'checkout' AND SeverityText ILIKE 'err%' AND Timestamp > now() - INTERVAL 1 HOUR;

-- Slowest routes (p95) from traces
SELECT SpanAttributes['http.route'] AS route, quantile(0.95)(Duration) / 1e6 AS p95_ms, count() AS calls
FROM otel_traces
WHERE ServiceName = 'checkout' AND SpanKind = 'Server' AND Timestamp > now() - INTERVAL 1 HOUR
GROUP BY route ORDER BY p95_ms DESC LIMIT 10;
Good to know : In Managed ClickStack, AI-assisted notebooks help write these analyses; always check the generated query before trusting the result.
Commands to know #
Commands to know
service:checkout level:err: property search"connection refused": exact phrase-level:info: exclusionLogAttributes['http.route']: read an attribute in SQLquantile(0.95)(Duration) / 1e6: p95 latency in milliseconds
Sources #
Checked in November 2026: ClickStack evolves fast (Managed ClickStack is in beta), check the ClickHouse documentation before relying on a detail.
My progress
Sign in to track your progress and take notes. Sign in
💬 Questions about this lesson
No questions yet: be the first to ask for help or share your configuration.
Recommended Articles
Sending telemetry to ClickStack: OpenTelemetry SDKs, collectors, logs, Kubernetes and browser sessions
Feeding ClickStack: ingestion key, OpenTelemetry SDK variables, forwarding through an existing co...
Alerts and dashboards in ClickStack
Building charts and dashboards in ClickStack, creating alerts on a search or a chart, sending the...
Observability on ClickHouse: why a columnar database changes the game
Why more and more observability platforms store logs, traces and metrics in ClickHouse: columnar ...
Telemetry in ClickHouse: schema, SQL, materialized views and retention
Telemetry in ClickHouse: otel_logs, otel_traces, otel_metrics_* and hyperdx_sessions tables, sort...
SigNoz, ClickStack and ClickHouse best practices for observability
Best practices for observability on ClickHouse with SigNoz or ClickStack: OpenTelemetry instrumen...
ClickStack: architecture, components and offerings (ClickHouse, HyperDX, OpenTelemetry)
ClickStack, ClickHouse's official observability stack: role of ClickHouse, the UI (HyperDX), the ...
Exploring data in Discover: KQL, Lucene and ES|QL
Search and analyze logs in Kibana Discover: filters, KQL, Lucene syntax, and the ES|QL language t...
Operating ClickHouse for ClickStack: sizing, replication, monitoring, security and backup
Running ClickHouse in production for observability: estimating volume and disk, replicating with ...
Operating an observability platform on ClickHouse and choosing a tool
Operate ClickHouse for telemetry (replication, disks, merges, object storage, monitoring) and com...