1. Choosing a deployment mode #
From developer machine to production.
The options #
Available in: ✓ Open source ✓ Managed ClickStack Managed ClickStack: ClickHouse Cloud
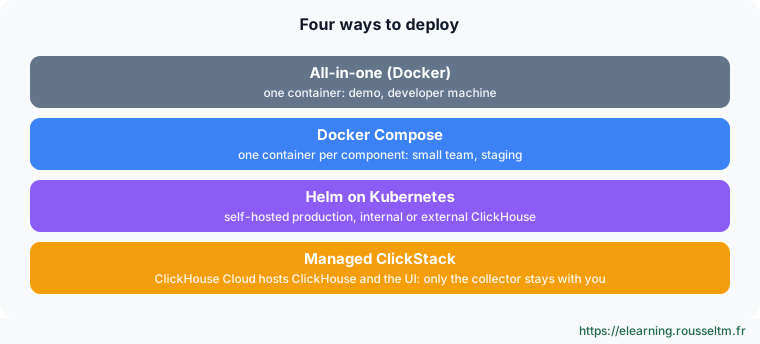
| Mode | For | Limit |
|---|---|---|
| All-in-one | discover, demo, develop | one container: no scaling, no isolation; data lost without volumes |
| Docker Compose | small team, staging, single server | no high availability |
| Helm | production on Kubernetes | ClickHouse to operate (or external) |
| Managed ClickStack | not operating ClickHouse or the UI | beta in 2026; data in ClickHouse Cloud |
2. The all-in-one container #
ClickHouse, UI, collector and MongoDB together.
With persistence #
mkdir -p .volumes/db .volumes/ch_data .volumes/ch_logs
docker run -d --name clickstack --restart unless-stopped \
  -p 8080:8080 -p 4317:4317 -p 4318:4318 \
  -v "$(pwd)/.volumes/db:/data/db" \
  -v "$(pwd)/.volumes/ch_data:/var/lib/clickhouse" \
  -v "$(pwd)/.volumes/ch_logs:/var/log/clickhouse-server" \
  clickhouse/clickstack-all-in-one:latest
# http://localhost:8080: create the first account (sources for the embedded database are created then)| Volume | Content |
|---|---|
/data/db | MongoDB: accounts, dashboards, alerts |
/var/lib/clickhouse | ClickHouse data (telemetry) |
/var/log/clickhouse-server | ClickHouse logs |
Watch out : Without volumes, everything is lost when the container is removed. Even with them, this mode is not for production: all processes share the same resources and cannot be sized or monitored separately.
Changing ports #
Only the host side changes: -p 4999:4318 publishes OTLP HTTP on port 4999. Changing UI (8080) or API (8000) ports also requires adjusting the matching variables.
3. Docker Compose #
One container per component.
Starting #
git clone https://github.com/ClickHouse/ClickStack.git && cd ClickStack
cat .env | grep -E 'IMAGE|PORT|VERSION'     # image versions, UI, API and OpAMP ports
docker compose up -d
docker compose ps                            # app (interface + API), otel-collector, clickhouse, db (MongoDB)
Useful variables (.env) #
| Variable | Role |
|---|---|
IMAGE_VERSION, CODE_VERSION | image version (pin it rather than latest) |
HYPERDX_APP_PORT | UI port (8080) |
HYPERDX_API_PORT | API port (8000) |
HYPERDX_OPAMP_PORT | OpAMP port driving the collector (4320) |
HYPERDX_APP_URL | public UI address (links in alerts) |
HYPERDX_OTEL_EXPORTER_CLICKHOUSE_DATABASE | ClickHouse database for telemetry tables |
Using ClickHouse Cloud #
Remove the ClickHouse service from the Compose file (and its depends_on), then give the collector the service HTTPS address (port 8443) and credentials. Then create the connection in the UI (Team Settings) and the sources.
# ClickStack collector to a ClickHouse Cloud service (instead of the local database)
otel-collector:
  image: clickhouse/clickstack-otel-collector:2
  environment:
    CLICKHOUSE_ENDPOINT: 'https://<service>.<region>.aws.clickhouse.cloud:8443'
    CLICKHOUSE_USER: 'otel_writer'
    CLICKHOUSE_PASSWORD: '${CH_PASSWORD}'
    HYPERDX_OTEL_EXPORTER_CLICKHOUSE_DATABASE: 'default'
    OPAMP_SERVER_URL: 'http://app:4320'
  ports: ['4317:4317', '4318:4318', '13133:13133']
4. Kubernetes with Helm #
The clickstack chart (v2).
Scenarios #
| Scenario | Settings |
|---|---|
| Full stack | defaults: ClickHouse (operator-managed), collector, UI |
| External ClickHouse | clickhouse.enabled: false and connection via hyperdx.defaultConnections or an existing Secret |
| External collector | otel-collector.enabled: false and hyperdx.otelExporterEndpoint |
| UI only | ClickHouse and collector disabled, connection to existing ones |
# Add the ClickStack Helm repository (URL given in the “Helm” documentation), then:
helm install my-clickstack clickstack/clickstack -n observability --create-namespace -f values.yaml

# values.yaml: external ClickHouse (for example ClickHouse Cloud), collector provided by the chart
clickhouse:
  enabled: false                 # do not deploy the embedded database (operator-managed)
hyperdx:
  defaultConnections: |          # UI connection to your ClickHouse (or an existing Secret)
    [{ "name": "prod", "host": "https://<service>:8443", "username": "hyperdx", "password": "…" }]
otel-collector:
  enabled: true
Good to know : The v1 chart (inline templates) is in maintenance: the documentation provides an upgrade guide to v2. Put passwords in a Secret (hyperdx.useExistingConfigSecret) rather than invalues.yaml.
5. Managed ClickStack and production #
Choosing and checking.
Managed ClickStack #
In ClickHouse Cloud, enable ClickStack on a service: the UI appears in the console, with its access control. You only deploy an OpenTelemetry collector near your applications, writing into the service. It is the simplest option if data can be hosted in ClickHouse Cloud.
Production checklist #
- Replicated ClickHouse (at least two replicas and ClickHouse Keeper) or ClickHouse Cloud; fast disks, object storage for cold data.
- Collectors sized for ingestion, several instances behind a load balancer, and a buffer queue if needed.
- MongoDB backed up (dashboards and alerts); TLS on the UI and on exposed OTLP endpoints.
- Retention (TTL) set per table and monitoring of ClickHouse itself (see the operations lesson).
- Pinned image versions and upgrades tested in staging.
Commands to know #
Commands to know
docker run … clickhouse/clickstack-all-in-one:latest: all-in-onedocker compose up -d: separate stackhelm install my-clickstack clickstack/clickstack -f values.yaml: Kubernetes deploymentcurl -s http://localhost:13133: collector healthdocker logs clickstack | tail: all-in-one container logs
Sources #
Checked in November 2026: ClickStack evolves fast (Managed ClickStack is in beta), check the ClickHouse documentation before relying on a detail.
My progress
Sign in to track your progress and take notes. Sign in
💬 Questions about this lesson
No questions yet: be the first to ask for help or share your configuration.
Recommended Articles
Exploring with the ClickStack UI: sources, search, traces, sessions and SQL
Using the ClickStack UI (HyperDX): data sources, property and full-text search syntax, SQL mode, ...
Installing Jaeger v2: all-in-one, configuration and storage
Run Jaeger v2 as all-in-one, understand its configuration file (jaeger_storage and jaeger_query e...
Installing OpenObserve and ingesting your first data
Install OpenObserve with Docker Compose or the binary, configure it with its ZO_* variables, send...
Installing Zabbix and monitoring your first host
Install Zabbix with Docker Compose (server, PostgreSQL, web interface), install agent 2 on a Linu...
Installing and configuring CrowdSec: packages, Docker, acquisition
Install CrowdSec with packages or Docker, understand its files, declare the logs to read, enroll ...
Deploying and operating Mimir on Kubernetes
Install Mimir with the mimir-distributed Helm chart, size the components, monitor Mimir with the ...
The observability trilemma: cost, completeness and performance, and how solutions resolve it
Understanding the observability trilemma (cost, data completeness, query performance), its three ...
Installing Phoenix and tracing your first LLM application
Install Arize Phoenix (pip, Docker), send your first OpenInference traces from an OpenAI applicat...
OneAgent: collection methods, installation, Kubernetes and health
Dynatrace collection methods (OneAgent, OpenTelemetry, Prometheus, API), installing OneAgent with...