1. The role of Cribl Edge #
The same engine, as an agent.
Principle #
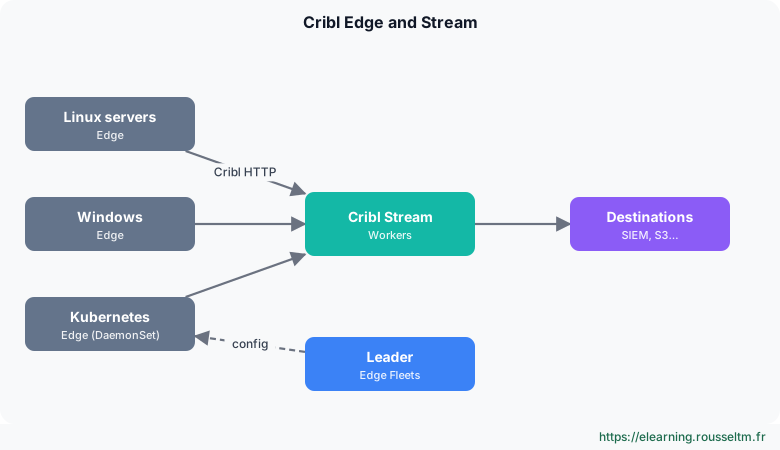
Cribl Edge is an agent installed on hosts or as a Kubernetes DaemonSet. It embeds the same engine as Stream (sources, routes, pipelines, destinations) and can therefore filter, mask and reduce at the source, saving bandwidth. Edge Nodes are driven by the Leader, grouped in Fleets (and Subfleets) sharing a configuration.
2. What Edge collects #
Local sources.
Sources #
| Source | Collects |
|---|---|
| File Monitor | log files, with automatic discovery and rotation tracking |
| Journal Files | journald (systemd) |
| Windows Event Logs | Application, System, Security, Sysmon logs… |
| System Metrics / Windows Metrics | CPU, memory, disks, network, processes |
| Kubernetes Logs / Metrics / Events | container logs, node and pod metrics, cluster events |
| Exec | output of a scheduled command (inventory, check) |
Edge also offers local exploration: from the Leader, you browse a host's files and processes to choose what to collect.
3. Deploying #
Linux, Windows, Kubernetes.
Methods #
- Linux: in the Leader, Add/Update Edge Node generates a command (install script with token and Fleet) to run on the host.
- Windows: MSI installer, with the same parameters (Leader, token, Fleet), deployable by GPO or endpoint management tool.
- Kubernetes: Edge Helm chart, deployed as a DaemonSet (one agent per node); the Leader UI provides the Helm command with the right parameters.
Watch out : Use the commands generated by your Leader: they contain the token, address and Fleet. Do not copy a command found online with a sample token.
Sending to Stream #
The Cribl HTTP destination (on Edge) and Cribl HTTP source (on Stream) pair is the recommended link: compressed, authenticated, and designed so data is not counted twice in the licence between Edge and Stream. Cribl TCP is the TCP equivalent.
4. Best practices #
A discreet agent.
Rules #
- One Fleet per host type (web servers, databases, Windows endpoints) and Subfleets per environment.
- Filter and mask on Edge; keep multi-tool routing and heavy enrichment on Stream.
- Limit the agent's resources (CPU, memory) and monitor its own metrics from the Leader.
- Test any new configuration on a small Subfleet before rolling it out.
Commands to know #
Commands to know
systemctl status cribl-edge: agent status on Linuxkubectl -n cribl get pods -o wide: cluster Edge agentsManage › Edge › Add/Update Edge Node: generate the install commandCribl HTTP (destination → source): Edge to Stream link
Sources #
Checked in November 2026 (Cribl 4.20): Cribl ships a minor release about every two months, check the release notes before relying on a detail.
My progress
Sign in to track your progress and take notes. Sign in
💬 Questions about this lesson
No questions yet: be the first to ask for help or share your configuration.
Recommended Articles
Pipelines and functions: parse, enrich, mask
Building Cribl Stream pipelines: pre-processing, processing and post-processing, the function cat...
Bindplane at scale: fleets, gateways and rollouts
Manage hundreds of collectors with Bindplane: edge fleets, gateways, labels, standard and progres...
Grafana Alloy: collecting and transforming telemetry
Learn how to use Grafana Alloy to collect, transform and route logs, metrics and traces. Discover...
Grafana Alloy: The importance of Self-Monitoring
Discover why and how to configure Grafana Alloy so that it monitors itself, collecting its own lo...
Bindplane: managing your OpenTelemetry telemetry pipelines
Understand Bindplane: a control plane for OpenTelemetry collectors via OpAMP, BDOT Collector, con...
Agent policies, integrations, data streams and pipelines
Build agent policies, add integrations (System, Nginx, Custom Logs), choose namespaces, customise...
Advanced Datadog logs: indexes, exclusion filters, Flex Logs, archives and Sensitive Data Scanner
Control the cost and compliance of Datadog logs: pipelines and processors, indexes and retention,...
Grafana Alloy: collecting system metrics and local logs
Learn how to configure Grafana Alloy to monitor the server it runs on, with a focus on configurat...
Logs in Datadog: collection, pipelines, indexes and volume control
Collect logs with the agent, structure them with pipelines and processors (grok), use facets and ...