1. What is a bucket? #
Grail’s storage unit.
Definition #
In Grail, every record (log line, span, event, business event) is stored in a bucket. A bucket is a logical container with three properties: the table it feeds (logs, spans, events, bizevents…), its retention period in days, and the rights needed to read it. It is the tool that lets you handle data differently.
Good to know: Metrics do not use buckets in the same way: their retention and resolution are managed by the platform. Buckets mainly concern logs, spans, events and business events.
Default buckets #
Each environment has default buckets, which receive data as long as no rule sends it elsewhere, and read-only system buckets.
| Bucket | Table | Content |
|---|---|---|
default_logs | logs | all logs not routed elsewhere |
default_spans | spans | distributed traces |
default_events | events | events (deployments, Davis, custom) |
default_bizevents | bizevents | business events |
dt_system_…, dt_… | varies | system data (billing, audit): read-only |
Depending on the version: The exact list and default retention (around 10 days for spans and 35 days for logs and events) depend on your contract and the platform version: check them in Storage management.
2. Why create your own buckets #
Four good reasons.
The motivations #
| Need | Example | Dedicated bucket |
|---|---|---|
| Different retention | audit kept 1 year, debug 7 days | logs_audit_1y, logs_debug_7d |
| Access rights | security logs visible to the security team only | logs_security |
| Cost | not paying 35 days of retention for verbose logs | logs_debug_7d |
| Query performance | query a targeted bucket rather than all logs | one bucket per main use |

Measure before splitting #
Start by looking at where volumes come from: a few sources often make up most of the data.
// Volume ingested per bucket and source over 7 days (before deciding on a strategy)
fetch logs, from: -7d
| summarize lines = count(), by: { dt.system.bucket, log.source }
| sort lines desc
| limit 30
Good practice: Aim for a few well-designed buckets (by retention and audience), not one bucket per application: too many buckets complicate rights, queries and maintenance, and their number per environment is limited.
3. Creating a bucket #
UI, API or Terraform.
In the UI #
- Open Storage management (Manage or Settings menu, depending on the version).
- Choose Create bucket.
- Enter the technical name (lowercase letters, digits and underscores, without a reserved prefix such as
dt_ordefault_), the display name, the table and the retention in days. - Save: the bucket becomes active after a few moments.
Common mistake: Choosing the name carelessly: it appears in routing rules, IAM policies and queries, and cannot be renamed. Adopt a convention, for example<table>_<use>_<retention>(logs_audit_1y).
With the API and Terraform #
Buckets are managed through the platform API (apps.dynatrace.com) with a platform token or an OAuth client that has rights on bucket definitions:
curl -X POST "https://abc12345.apps.dynatrace.com/platform/storage/management/v1/bucket-definitions" \
  -H "Authorization: Bearer $DT_PLATFORM_TOKEN" -H "Content-Type: application/json" \
  -d '{
    "bucketName": "logs_audit_1y",
    "displayName": "Audit logs (1 year)",
    "table": "logs",
    "retentionDays": 365
  }'
curl -H "Authorization: Bearer $DT_PLATFORM_TOKEN" \
"https://abc12345.apps.dynatrace.com/platform/storage/management/v1/bucket-definitions"resource "dynatrace_platform_bucket" "audit" {
name = "logs_audit_1y"
display_name = "Audit logs (1 year)"
table = "logs"
retention = 365
}Depending on the version: Exact API endpoint, permission and Terraform resource names may change: check the Storage management API and Dynatrace Terraform provider reference for your version.
Good practice: Declare buckets as code (Terraform or Monaco) together with the OpenPipeline rules and IAM policies that use them: the whole setup can be recreated identically in another environment.
4. Routing data #
OpenPipeline decides the bucket.
Storage rules #
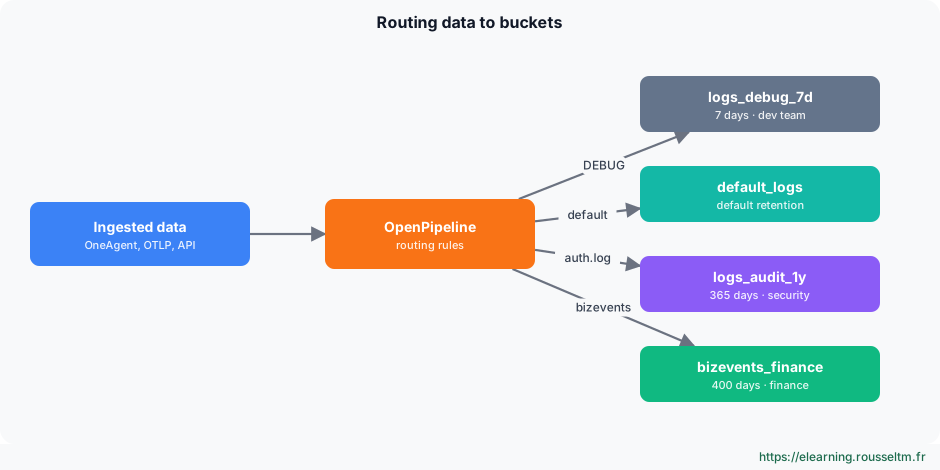
An empty bucket is useless: data must be sent to it. In OpenPipeline, each pipeline ends with a storage step that assigns records to a bucket based on a DQL condition. Records that match no rule go to the default bucket.
// Routing condition (OpenPipeline): Linux authentication logs to the audit bucket
matchesValue(log.source, "/var/log/auth.log") or matchesValue(log.source, "/var/log/secure")

// Debug logs of a namespace to the short bucket
k8s.namespace.name == "shop" and loglevel == "DEBUG"
Details on pipelines, routing and processing in Advanced logs with OpenPipeline.
Good to know: Routing applies to data received after it is set up: data already stored stays in its original bucket until its retention ends.
Depending on the version: On environments not yet migrated to OpenPipeline for logs, assignment is done with the bucket assignment rules of log processing (Log Monitoring); the principle is the same.
5. Querying and controlling #
DQL and IAM rights.
Targeting a bucket in DQL #
Each record carries its bucket name in the dt.system.bucket field. Filtering on it reduces the volume read, and therefore response time and query cost.
// Read only the audit bucket
fetch logs, from: -30d
| filter dt.system.bucket == "logs_audit_1y"
| filter contains(content, "sudo")
| fields timestamp, host.name, content
| sort timestamp desc
// List the environment's buckets and their retention
fetch dt.system.buckets
| fields name, table, retentionDays, status
| sort name ascDepending on the version: Listing buckets with DQL (fetch dt.system.buckets) and its fields depend on the version; the Storage management app gives the same information.Per-bucket rights #
IAM policies can restrict reading to certain buckets, and reserve bucket creation and changes to administrators:
// Security team: read logs of the audit bucket only
ALLOW storage:logs:read, storage:buckets:read
  WHERE storage:bucket-name = "logs_audit_1y";

// Platform administrators: create and modify buckets
ALLOW storage:bucket-definitions:read, storage:bucket-definitions:write;
Principles and organisation of rights: Managing permissions.
Common mistake: Granting storage:logs:read with no condition: the person can then read every log bucket, including audit. Add the condition on the bucket name.6. Changing, emptying, deleting #
Operations to handle with care.
The effects #
| Operation | Effect |
|---|---|
| Increase retention | existing data is kept longer |
| Reduce retention | data older than the new period is deleted |
| Empty the bucket | all its data is deleted, the bucket remains |
| Delete the bucket | the bucket and its data disappear; rules using it must be fixed |
Common mistake: Reducing a retention to save money without checking legal or contractual obligations: deletion is permanent. Document the chosen period for each bucket (see Data retention in Dynatrace).
7. Costs #
What retention costs.
What is billed #
With DPS licensing, Grail data is billed on ingestion, retention (volume kept multiplied by duration) and queries (volume read). The bucket choice therefore directly affects the bill (see Dynatrace licensing and Licensing and FinOps).
- Send verbose logs to a short bucket rather than keeping them 35 days.
- For a long-term indicator, extract a metric in OpenPipeline and keep the raw log briefly.
- Drop at ingestion what is never used (health probes, chatty library logs).
Depending on the version: Depending on the contract, some retention offers include part of the queries: compare your subscription options before setting durations.
8. Commands to know and lab #
The cheat sheet and a guided exercise.
Commands to know #
| Action | Command or screen |
|---|---|
| See buckets and their retention | Storage management, or fetch dt.system.buckets |
| Create a bucket | POST /platform/storage/management/v1/bucket-definitions |
| Measure volume per bucket | fetch logs | summarize count(), by: { dt.system.bucket } |
| Read one bucket | | filter dt.system.bucket == "…" |
| Route to a bucket | OpenPipeline, storage step with a DQL condition |
| Restrict reading | WHERE storage:bucket-name = "…" |
Lab: an audit bucket #
- Measure the volume of Linux authentication logs over 7 days (
log.sourcecontainingauth.logorsecure). - Create the
logs_audit_1ybucket (logs table, 365 days), in the UI or with the API. - In OpenPipeline, add a storage rule that sends these logs to the new bucket.
- Trigger a few SSH logins on a monitored host, then check with the query in section 5 that new lines arrive in
logs_audit_1y. - Create an IAM policy that reserves reading this bucket to the security group, and test with an account outside it.
Expected result: authentication logs are kept for one year, readable by the security team only, and other logs keep the default retention.
My progress
Sign in to track your progress and take notes. Sign in
💬 Recent discussions about this course
- Dynatrace : mes pods Kubernetes ne sont pas instrumentés malgré le DynaKube✓ solved · 1 reply(ies)
Ask a question about this lesson →See all discussions about this course
Course Glossary
AIOps (Artificial Intelligence for IT Operations)
The use of artificial intelligence and machine learning to automate and improve IT operations (e.g., anomaly detection, reducing alert noise).
OpenTelemetry
An open source framework providing standards, APIs, and SDKs to collect and export observability data (traces, metrics, logs) in an agnostic way.
Core Web Vitals
Set of three metrics defined by Google to measure the real experience of a web page: loading (LCP (Largest Contentful Paint)), responsiveness (INP (In...
LCP (Largest Contentful Paint)
Time until the largest visible element of the page (image, video or text block) is rendered: it shows when the main content appears. Loading metric of...
INP (Interaction to Next Paint)
Latency of interactions (click, tap, key press) observed over the whole visit: the delay between the user's action and the next paint. The reported va...
CLS (Cumulative Layout Shift)
Measure of visual stability: the sum of unexpected layout shifts (a button moving just as you click, text pushed down by an ad). Unitless, computed ov...
FCP (First Contentful Paint)
Time until the first content (text, image, SVG) is rendered: the moment the user sees the page start loading. It is not a Core Web Vital, but it helps...
TTFB (Time to First Byte)
Time between the start of navigation and the arrival of the first byte of the response: it adds up redirects, DNS, TCP/TLS connection and server proce...
FID (First Input Delay)
Former responsiveness metric of the Core Web Vitals: the delay before the browser starts handling the first interaction (good ≤ 100 ms). It ignored la...
TBT (Total Blocking Time)
Lab metric (Lighthouse): the sum, between FCP (First Contentful Paint) and the end of loading, of the blocking part of each long task (over 50 ms) on ...
CrUX (Chrome UX Report)
Google's public dataset aggregating the Core Web Vitals measured from real Chrome users (at the 75th percentile, per origin and URL, over a rolling 28...
Lighthouse
Google's free audit tool, built into Chrome DevTools and PageSpeed Insights: it loads the page in a simulated environment and scores performance, acce...
Apdex
Application Performance Index: a satisfaction score between 0 and 1 based on a time threshold T. Requests under T are “satisfied”, between T and 4T “t...
Recommended Articles
Advanced logs with OpenPipeline: processing, masking, buckets and retention
Manage logs in Dynatrace with OpenPipeline: ingestion, routing, DQL processing (parsing, enrichme...
Grail: the Dynatrace data lakehouse and the DQL language
Grail stores all Dynatrace SaaS observability data (logs, metrics, traces, events, entities) with...
Data retention in Dynatrace: Grail, buckets and durations by data type
Understand how long Dynatrace keeps logs, traces, metrics, sessions and events, manage retention ...
Advanced Grail and DQL: performance, parse, joins, time series, entities and correlation
Writing fast, low-cost DQL queries, parsing text with DPL and JSON, combining sources with lookup...
DQL in practice: exploring logs and events, notebooks, dashboards and performance
Use the Dynatrace Query Language day to day: explore logs and events, chain commands, parse field...
The Dynatrace Investigations app: investigating Grail data
Discover the Investigations app: DQL queries, extraction with DPL Architect, enrichment, query tr...
Using the Dynatrace API v2: a complete guide to automation
Learn how to use the Dynatrace API to automate your observability: managing scopes, routing throu...
License consumption types
Understand the evolution of billing in Dynatrace: the difference between the old licensing model ...
Differences between Technologies and Services in Dynatrace
In Dynatrace, the concepts of 'Technology' and 'Services' help organize and monitor application p...