1. Monitoring the fleet #
Fleet and agent monitoring.
States #

Enable agent monitoring in the policy: each agent ships its own logs and metrics (logs-elastic_agent*, metrics-elastic_agent*) and Fleet shows the state of each component.
On the host #
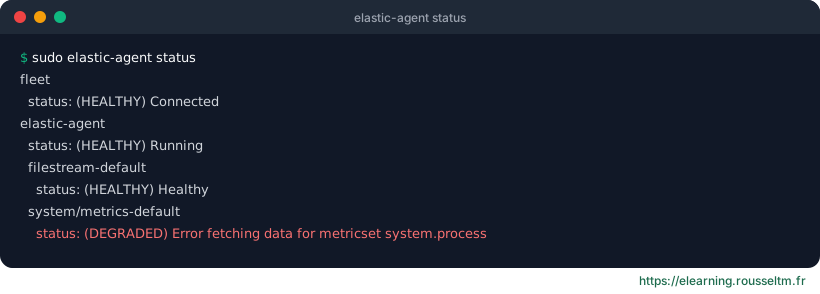
sudo elastic-agent status --output=full
sudo elastic-agent inspect           # politique effective
sudo journalctl -u elastic-agent -f  # journaux du service
2. Upgrading #
In batches, without interruption.
The approach #
- Upgrade Elasticsearch and Kibana first: the agent must not be newer than them.
- Upgrade Fleet Server.
- Upgrade a pilot batch of agents from Fleet (select by policy or tag).
- Roll out with a progressive (rolling) or scheduled upgrade.
sudo elastic-agent upgrade 9.x.y # agent autonome ; les agents gérés se mettent à jour depuis Fleet3. Troubleshooting #
Diagnostics and common problems.
The diagnostics bundle #
sudo elastic-agent diagnostics   # crée un .zip : politique, logs, état, profils
# ou depuis Fleet : Agent › Actions › Request diagnostics .zip
Common problems #
| Symptom | Likely cause | Check |
|---|---|---|
| Agent offline | Fleet Server unreachable, proxy, firewall | curl -v https://fleet.exemple.fr:8220/api/status |
| Healthy agent but no data | Wrong Elasticsearch output, API key permissions | agent logs: 401/403 errors |
| Certificate error | Missing certificate authority | --certificate-authorities |
| Missing logs | Wrong path or read permissions | elastic-agent inspect |
| Duplicate documents | Beat and integration on the same files | stop the old collector |
Air-gapped sites #
Good to know: Without Internet access, host the Elastic Package Registry and the agent binary registry internally, then set their URLs in Kibana (Fleet › Settings).
My progress
Sign in to track your progress and take notes. Sign in
💬 Questions about this lesson
No questions yet: be the first to ask for help or share your configuration.
Recommended Articles
Elastic Agent in production: best practices
Elastic Agent best practices: security, policy organisation, volume control, Fleet Server high av...
Elastic Agent: architecture, Fleet and integrations
Understand Elastic Agent: single collection agent, Fleet and Fleet Server, agent policies, integr...
Installing Fleet Server and enrolling Elastic Agents
Set up Fleet Server, create a policy, enroll Linux, Windows and Docker agents, understand tokens ...
Elastic Agent or Beats? Choosing and migrating
Compare Elastic Agent and Beats (Filebeat, Metricbeat, Winlogbeat), know when to keep Beats, and ...
Elastic Agent on Kubernetes
Deploy Elastic Agent on Kubernetes: Fleet-managed DaemonSet, Kubernetes integration, kube-state-m...
Standalone Elastic Agent, Logstash and Kafka outputs, and OpenTelemetry (EDOT)
Write a standalone configuration, ship to Logstash or Kafka, and use Elastic Agent as an OpenTele...
Agent policies, integrations, data streams and pipelines
Build agent policies, add integrations (System, Nginx, Custom Logs), choose namespaces, customise...
Elastic Observability: logs, infrastructure, APM and synthetics
Elastic Observability features: log exploration, infrastructure inventory with Elastic Agent and ...
Elasticsearch on Kubernetes with ECK: deployment, persistent storage and upgrades
Deploy Elasticsearch and Kibana on Kubernetes with Elastic Cloud on Kubernetes (ECK): operator, E...