1. What is a conversion funnel? #
The concept and its vocabulary.
The principle #
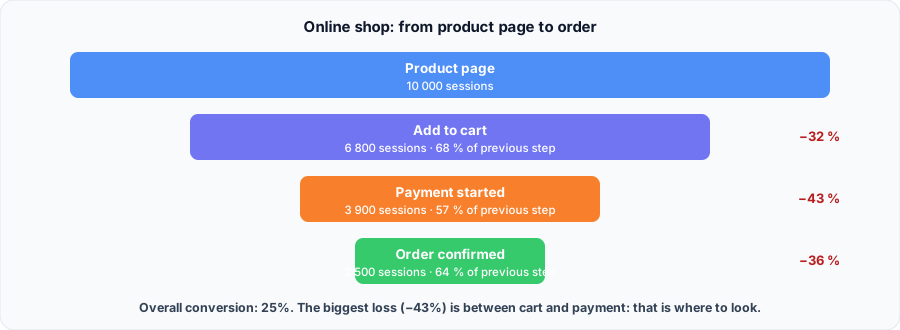
A conversion funnel follows the steps of an expected journey, for example product page, cart, payment, order, and counts how many sessions reach each one. It answers a simple question: where do users drop off?
RUM (Real User Monitoring) is an ideal source: it sees real sessions, in the real browser, with their errors and slowness. A RUM funnel does not only say how many drop off, it helps understand why.
The vocabulary #
| Term | Definition |
|---|---|
| Step | An observable event: a page view, a click, a business event |
| Step rate | Sessions at the step ÷ sessions at the previous step |
| Overall conversion | Sessions at the last step ÷ sessions at the first |
| Drop-off | 1 − step rate: the share lost between two steps |
| Unit | What you count: session (most common in RUM) or user |
| Window | The period in which steps must happen |
2. Building your funnel properly #
The choices that change the numbers.
Step order #
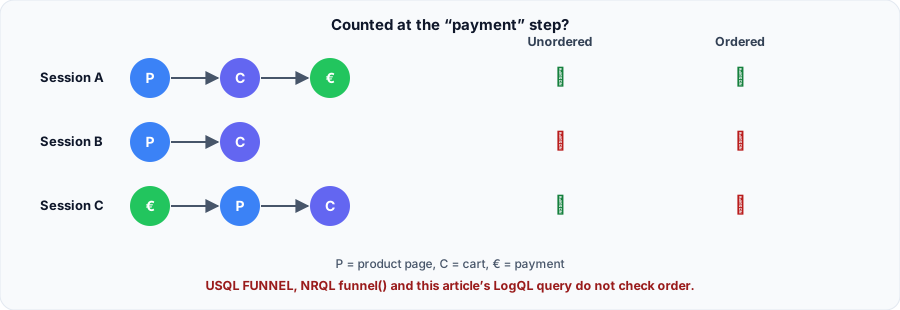
Many tools do not check order: a session that performed all steps, in any order, is counted. Dynatrace's documentation says so for USQL FUNNEL, New Relic's for funnel(). We checked it on Loki with the part 3 query: a session paying before seeing the product is counted to the end.
For a linear journey (cart then payment), the gap is small. For steps that can repeat or be reversed, prefer a tool that enforces order, such as Datadog funnels.
Best practices #
- 3 to 6 steps, each tied to a user decision. Beyond that, the funnel becomes unreadable.
- Stable event names:
add_to_carteverywhere, neveraddToCarton one page andcart_addelsewhere. - Count distinct sessions, not events: a user reloading the page must not inflate a step.
- Segment: browser, device, country, app version. A drop concentrated on mobile Safari points to a bug, not to pricing.
- Cross with technical data: JavaScript errors, load times and Core Web Vitals of the pages where users drop off.
- Protect data: never put an e-mail, name or exact per-customer amount in event attributes.
3. Grafana Faro #
Faro events and LogQL queries.
Instrumenting steps #
Faro has no funnel screen: you build it with events, sent with pushEvent and stored in Loki with the kind=event label.
// One step = one named event, always with the same names
faro.api.pushEvent('vue_produit', { produit: 'casque-x' });
faro.api.pushEvent('ajout_panier', { produit: 'casque-x', quantite: '1' });
faro.api.pushEvent('paiement', { moyen: 'carte' });
// Two identical events in a row are deduplicated by Faro:
faro.api.pushEvent('ajout_panier', { produit: 'casque-x' }, undefined, { skipDedupe: true });
Counting each step in LogQL #
Distinct sessions that viewed a product:
count(
  sum by (session_id) (count_over_time({app_name="boutique", kind="event"} | logfmt | event_name="vue_produit" [24h]))
)
Sessions that viewed a product and added to cart: the and operator only keeps sessions present in both results.
count(
    sum by (session_id) (count_over_time({app_name="boutique", kind="event"} | logfmt | event_name="vue_produit"  [24h]))
  and
    sum by (session_id) (count_over_time({app_name="boutique", kind="event"} | logfmt | event_name="ajout_panier" [24h]))
)
Third step:
count(
    sum by (session_id) (count_over_time({app_name="boutique", kind="event"} | logfmt | event_name="vue_produit"  [24h]))
  and
    sum by (session_id) (count_over_time({app_name="boutique", kind="event"} | logfmt | event_name="ajout_panier" [24h]))
  and
    sum by (session_id) (count_over_time({app_name="boutique", kind="event"} | logfmt | event_name="paiement"     [24h]))
)| Query | Test result |
|---|---|
| Product | 4 |
| Product and cart | 3 |
| Product, cart and payment | 2 (including one session that paid first) |
The simple count trap. sum by (event_name) (count_over_time(...)) gave 4 cart additions for 4 product views: one session added to cart without the product page. Count sessions that went through the previous steps, not events.In Grafana, put each query in a Bar gauge or Stat panel, one query per step, to get a readable funnel. These queries were tested on Loki 3.7.9.
4. Dynatrace #
Conversion goals, USQL and DQL.
RUM Classic: USQL FUNNEL #
With RUM Classic, first declare conversion goals on the application, then use the USQL FUNNEL function:
SELECT FUNNEL(
  useraction.name = "AppStart (easyTravel)" AS "Open",
  useraction.name = "searchJourney" AS "Search",
  useraction.name = "bookJourney" AS "Book",
  useraction.matchingConversionGoals = "Payment" AS "Paid")
FROM usersession
WHERE stringProperties.memberstatus = "GOLD"- 10 conditions at most.
- No
GROUP BY,ORDER BYorLIMIT. - Order is not guaranteed: the documentation states nothing ensures the first action precedes the second.
Combined with Session Replay, the funnel lets you replay sessions that drop off at a step.
New RUM experience: DQL #
On the Grail platform, RUM data lives in the user.events table, queried with DQL. The documentation shows how to count sessions per page:
fetch user.events
| filter characteristics.has_navigation
| summarize sessions = countDistinct(dt.rum.session.id), by: {view = view.url.path}
| sort sessions desc
On this model, a funnel is built in two aggregations: first one row per session with the number of visits per step, then the count of sessions that went through each step and the previous ones.
fetch user.events, from: now() - 7d
| filter characteristics.has_navigation
| summarize {
    produit  = countIf(view.url.path == "/produit"),
    panier   = countIf(view.url.path == "/panier"),
    paiement = countIf(view.url.path == "/paiement")
  }, by: {dt.rum.session.id}
| summarize {
    `1. Produit`  = countIf(produit > 0),
    `2. Panier`   = countIf(produit > 0 and panier > 0),
    `3. Paiement` = countIf(produit > 0 and panier > 0 and paiement > 0)
  }
Validate in your environment. Fields come from the new RUM experience documentation, still evolving; we could not run this query. Adapt page paths to your application.
5. Datadog and New Relic #
Two other approaches.
Datadog #
Datadog offers a dedicated screen, Digital Experience > Product Analytics > Funnels: you pick a starting view or action, then add steps with the + button. Actions happening between two steps do not affect the rates. Funnel queries can be reused in a RUM monitor to alert on a conversion rate drop.
New Relic #
FROM PageView
SELECT funnel(session,
  WHERE pageUrl LIKE '%browse%' AS 'Browse',
  WHERE pageUrl LIKE '%cart%' AS 'Cart',
  WHERE pageUrl LIKE '%checkout%' AS 'Checkout')
SINCE 1 week AGO- One grouping attribute per query (
sessionhere). - 10 steps at most; approximate results beyond 256 distinct values.
- Order is not enforced: the first step is always 100%.
Summary #
| Tool | How | Step order |
|---|---|---|
| Grafana Faro | pushEvent + LogQL in Grafana | Not checked |
| Dynatrace (Classic) | Conversion goals + USQL FUNNEL | Not guaranteed |
| Dynatrace (new RUM) | DQL on user.events | To build in the query |
| Datadog | Funnels screen, alerts | Successive steps |
| New Relic | NRQL funnel() | Not enforced |
Sources #
My progress
Sign in to track your progress and take notes. Sign in
💬 Questions about this lesson
No questions yet: be the first to ask for help or share your configuration.
Course Glossary
Core Web Vitals
Set of three metrics defined by Google to measure the real experience of a web page: loading (LCP (Largest Contentful Paint)), responsiveness (INP (In...
LCP (Largest Contentful Paint)
Time until the largest visible element of the page (image, video or text block) is rendered: it shows when the main content appears. Loading metric of...
INP (Interaction to Next Paint)
Latency of interactions (click, tap, key press) observed over the whole visit: the delay between the user's action and the next paint. The reported va...
CLS (Cumulative Layout Shift)
Measure of visual stability: the sum of unexpected layout shifts (a button moving just as you click, text pushed down by an ad). Unitless, computed ov...
FCP (First Contentful Paint)
Time until the first content (text, image, SVG) is rendered: the moment the user sees the page start loading. It is not a Core Web Vital, but it helps...
TTFB (Time to First Byte)
Time between the start of navigation and the arrival of the first byte of the response: it adds up redirects, DNS, TCP/TLS connection and server proce...
FID (First Input Delay)
Former responsiveness metric of the Core Web Vitals: the delay before the browser starts handling the first interaction (good ≤ 100 ms). It ignored la...
TBT (Total Blocking Time)
Lab metric (Lighthouse): the sum, between FCP (First Contentful Paint) and the end of loading, of the blocking part of each long task (over 50 ms) on ...
CrUX (Chrome UX Report)
Google's public dataset aggregating the Core Web Vitals measured from real Chrome users (at the 75th percentile, per origin and URL, over a rolling 28...
Lighthouse
Google's free audit tool, built into Chrome DevTools and PageSpeed Insights: it loads the page in a simulated environment and scores performance, acce...
Apdex
Application Performance Index: a satisfaction score between 0 and 1 based on a time threshold T. Requests under T are “satisfied”, between T and 4T “t...
Recommended Articles
Real User Monitoring (RUM) and Core Web Vitals: measuring what users experience
Why observe the front end, what RUM measures, Core Web Vitals (LCP, INP, CLS) and their threshold...
Faro: JavaScript errors, logs, business events and sessions
Use the Faro API: automatic error capture, manual error reporting, logs, business events and meas...
Analyzing user experience in Dynatrace: sessions, traces, analysis and USQL
Use digital experience (DEM) data: Apdex and Core Web Vitals, user sessions, service flows, distr...
Faro and Alloy: receiving front-end RUM with faro.receiver
Configure faro.receiver: CORS, API key, rate limiting, source maps, then send browser errors, Web...
Dynatrace Real User Monitoring: injection, web applications and verification
Set up real user monitoring in Dynatrace: automatic injection by OneAgent, agentless monitoring, ...
Grafana Faro: architecture and installation
Install Grafana Faro: the web SDK (npm or CDN), Alloy's faro.receiver, sending to Loki and Tempo,...
RUM and Synthetic Monitoring with Datadog: synthetic transaction monitoring and user experience
Measure user experience with Datadog: browser and mobile RUM, Core Web Vitals, Session Replay, li...
Using Faro data: queries, dashboards, alerts and GDPR
Query Faro data in Loki (Web Vitals, errors, events), build dashboards and alerts, and comply wit...
Front-end observability best practices with Faro
Checklist for useful, respectful RUM: SDK configuration, versions, source maps, correlation with ...