1. OpenObserve at a glance #
An observability platform in a single binary.
Overview #
OpenObserve is an open source observability platform written in Rust. It brings logs, metrics and traces, dashboards, alerts and data pipelines into one product. Its distinctive feature: data is stored in columns, in Parquet format, on disk or in object storage, without a full inverted index as in Elasticsearch. Storage gets much cheaper; the vendor announces very large gaps, to be checked on your own data.
A single binary is enough to start: no cluster to build, no JVM. In our tests, a local node used about 370 MB of memory.
Open source or Enterprise? #
| Open source (AGPL-3.0) | Enterprise | |
|---|---|---|
| Logs, metrics, traces, dashboards, alerts | Yes | Yes |
| Configurable retention | Yes | Yes |
| Pipelines | Yes, without remote destinations | Yes |
| Fine-grained access (custom roles) | No | Yes |
| SSO, federated search, full audit trail | No | Yes |
To check: the split and conditions change over time. The vendor also offers the self-hosted Enterprise edition free below a daily ingestion threshold: see the official page. This course uses the open source edition.
2. Architecture #
From a single binary to a cluster.
Two deployment modes #
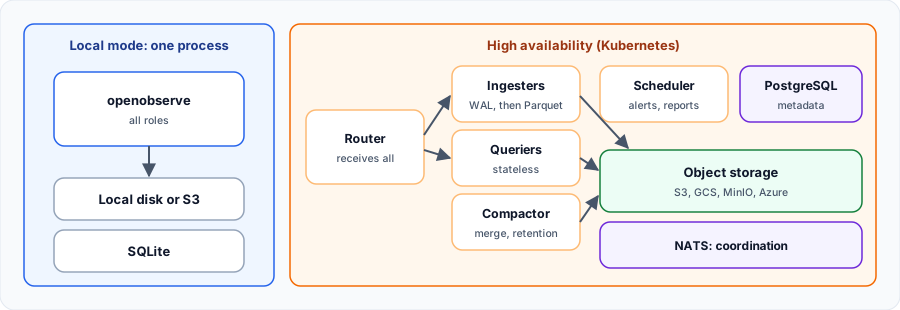
| Role | Purpose |
|---|---|
| Router | Receives and routes requests, serves the UI |
| Ingester | Receives data, writes the WAL, produces Parquet and uploads it |
| Querier | Runs searches; stateless |
| Compactor | Merges small files and enforces retention |
| Scheduler | Runs scheduled alerts and reports |
In high availability, PostgreSQL holds metadata and NATS handles coordination. Local disk is not supported there.
The journey of a record #
- The ingester writes the event to a WAL and to memory.
- Data is periodically converted to local Parquet files, already searchable.
- These files are uploaded to object storage.
- The compactor merges small files to speed up searches.
3. Concepts #
The vocabulary to know.
Organization, stream and schema #
| Concept | Meaning |
|---|---|
| Organization | Isolated space; the default in URLs |
| Stream | Equivalent of an index; it has a type: logs, metrics or traces |
| Schema | Created and extended automatically at ingestion |
_timestamp | Timestamp of each event, in microseconds |
OpenObserve versus other tools #
| Need | OpenObserve | Other choice |
|---|---|---|
| Simple all-in-one | One binary, three signals | SigNoz, ClickStack (ClickHouse) |
| Very rich full-text search | Simpler, SQL | Elasticsearch, OpenSearch |
| Grafana ecosystem | Own UI, PromQL compatible | Loki, Mimir, Tempo |
My progress
Sign in to track your progress and take notes. Sign in
Recommended Articles
Les concepts fondamentaux d'OpenTelemetry : signaux, ressources, contexte et maturité
Le vocabulaire indispensable d'OpenTelemetry : les quatre signaux, API et SDK, ressource et instr...
Les Data Sources dans Grafana : Connectez et unifiez vos données
Apprenez à étendre les capacités de Grafana via les Data Sources. Découvrez les plugins essentiel...
Grafana Alloy: The importance of Self-Monitoring
Discover why and how to configure Grafana Alloy so that it monitors itself, collecting its own lo...
Grafana Alloy vs Dynatrace ActiveGate: Which to choose?
Comparison between Grafana Alloy and Dynatrace ActiveGate. Understand the fundamental differences...
Grafana Alloy vs OpenTelemetry Collector: Which One Should You Choose?
A detailed comparison between Grafana Alloy and the OpenTelemetry Collector. Discover the strengt...
Tempo : stockage objet, blocs, compactor et déploiement distribué
Configurer le stockage de Tempo : S3/GCS/Azure, format Parquet vParquet4, WAL, compactor et réten...
Grafana Alloy: Understanding and exploiting the User Interface (UI)
Discover how to enable, secure, and use Grafana Alloy's built-in web interface to visualize your ...
Architecture OpenTelemetry : Comprendre les 3 niveaux
Plongée au cœur de l'architecture OpenTelemetry. Apprenez comment les données circulent de l'appl...
OpenSearch Dashboards, alerting and observability
Explore data in OpenSearch Dashboards, create alert monitors and discover Trace Analytics, Event ...