1. OpenObserve at a glance #
An observability platform in a single binary.
Overview #
OpenObserve is an open source observability platform written in Rust. It brings logs, metrics and traces, dashboards, alerts and data pipelines into one product. Its distinctive feature: data is stored in columns, in Parquet format, on disk or in object storage, without a full inverted index as in Elasticsearch. Storage gets much cheaper; the vendor announces very large gaps, to be checked on your own data.
A single binary is enough to start: no cluster to build, no JVM. In our tests, a local node used about 370 MB of memory.
Open source or Enterprise? #
| Open source (AGPL-3.0) | Enterprise | |
|---|---|---|
| Logs, metrics, traces, dashboards, alerts | Yes | Yes |
| Configurable retention | Yes | Yes |
| Pipelines | Yes, without remote destinations | Yes |
| Fine-grained access (custom roles) | No | Yes |
| SSO, federated search, full audit trail | No | Yes |
To check: the split and conditions change over time. The vendor also offers the self-hosted Enterprise edition free below a daily ingestion threshold: see the official page. This course uses the open source edition.
2. Architecture #
From a single binary to a cluster.
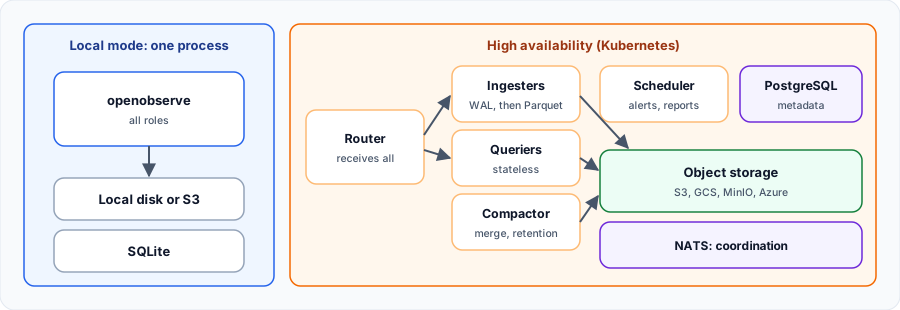
Two deployment modes #
| Role | Purpose |
|---|---|
| Router | Receives and routes requests, serves the UI |
| Ingester | Receives data, writes the WAL, produces Parquet and uploads it |
| Querier | Runs searches; stateless |
| Compactor | Merges small files and enforces retention |
| Scheduler | Runs scheduled alerts and reports |
In high availability, PostgreSQL holds metadata and NATS handles coordination. Local disk is not supported there.
The journey of a record #
- The ingester writes the event to a WAL and to memory.
- Data is periodically converted to local Parquet files, already searchable.
- These files are uploaded to object storage.
- The compactor merges small files to speed up searches.
3. Concepts #
The vocabulary to know.
Organization, stream and schema #
| Concept | Meaning |
|---|---|
| Organization | Isolated space; the default in URLs |
| Stream | Equivalent of an index; it has a type: logs, metrics or traces |
| Schema | Created and extended automatically at ingestion |
_timestamp | Timestamp of each event, in microseconds |
OpenObserve versus other tools #
| Need | OpenObserve | Other choice |
|---|---|---|
| Simple all-in-one | One binary, three signals | SigNoz, ClickStack (ClickHouse) |
| Very rich full-text search | Simpler, SQL | Elasticsearch, OpenSearch |
| Grafana ecosystem | Own UI, PromQL compatible | Loki, Mimir, Tempo |
My progress
Sign in to track your progress and take notes. Sign in
Recommended Articles
Sending logs, metrics and traces to OpenObserve
OpenObserve receiving endpoints: JSON, bulk, OTLP with the OpenTelemetry Collector, Prometheus re...
Exploring data in OpenObserve: SQL, PromQL and VRL
Search with SQL, query metrics with PromQL, optimize a stream (indexes, partitions, retention) an...
Installing OpenObserve and ingesting your first data
Install OpenObserve with Docker Compose or the binary, configure it with its ZO_* variables, send...
OpenObserve in production: best practices
Choose your deployment mode, organize streams, secure, back up and monitor OpenObserve in product...
Alerts and pipelines in OpenObserve
Create a template, a destination and an alert, avoid the SSRF webhook block and process data with...
Grafana Alloy: Introduction and Architecture
Discover the fundamental concepts of Grafana Alloy, the transition from the static Agent to Alloy...
La stack LGTM (Loki, Grafana, Tempo, Mimir) : architecture et mise en place
Comprendre la stack LGTM de Grafana Labs : Loki pour les logs, Grafana pour la visualisation, Tem...
Grafana Loki : le système de logs inspiré de Prometheus
Découvrir Grafana Loki : philosophie d'indexation par labels, architecture (distributor, ingester...
Grafana Assistant: AI at the service of observability
Discover Grafana Assistant, the artificial intelligence integrated into Grafana Cloud. Learn how ...