1. Where to transform data? #
Data Prepper or ingest pipeline.
Two levels #
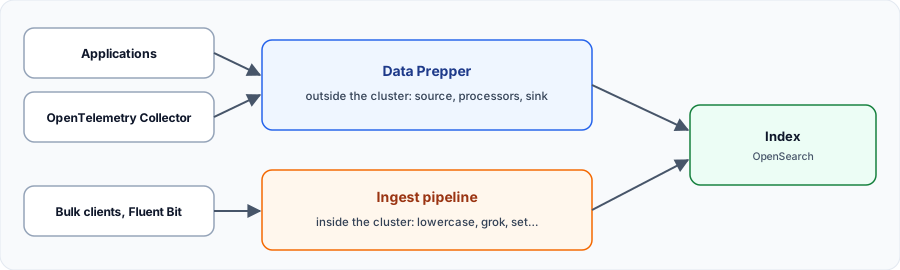
| Ingest pipeline | Data Prepper | |
|---|---|---|
| Where? | Inside the cluster | Separate service |
| For | Simple transformations | Heavy processing, OpenTelemetry, routing |
| Sources | Indexing requests | HTTP, OTLP, S3, Kafka… |
| Load | On OpenSearch nodes | On its own servers |
2. Ingest pipelines #
Transforming at indexing time.
Create and simulate #
curl -sk -u 'admin:Str0ng!Passw0rd-2026' -H 'Content-Type: application/json' -X PUT https://localhost:9200/_ingest/pipeline/logs_nettoyage -d '{
  "description": "Normalizes the level and extracts the user",
  "processors": [
    {"lowercase": {"field": "level"}},
    {"set": {"field": "environnement", "value": "prod"}},
    {"grok": {"field": "message", "patterns": ["utilisateur=%{WORD:utilisateur}"], "ignore_failure": true}}
  ]
}'

# Try without indexing anything
curl -sk -u 'admin:Str0ng!Passw0rd-2026' -H 'Content-Type: application/json' -X POST https://localhost:9200/_ingest/pipeline/logs_nettoyage/_simulate \
  -d '{"docs":[{"_source":{"level":"ERROR","message":"refus utilisateur=alice"}}]}'
The simulation result contains level: error, environnement: prod and utilisateur: alice. To use it: _bulk?pipeline=logs_nettoyage, or the index.default_pipeline setting in the template.
Best practice: always test with_simulate, and planignore_failureoron_failure: otherwise a single failinggrokrejects the document.
3. Data Prepper #
The OpenSearch project collector.
A log pipeline #
A pipeline has a source, processors and a sink. This one was tested end to end on Data Prepper 2.16:
log-pipeline:
  source:
    http:
      ssl: false
      port: 2021
      path: /log/ingest
  processor:
    - grok:
        match:
          log: ['%{COMMONAPACHELOG}']
    - date:
        match:
          - key: timestamp
            patterns: ["dd/MMM/yyyy:HH:mm:ss Z"]
        destination: "@timestamp"
    - convert_type:
        key: response
        type: integer
    - delete_entries:
        with_keys: ["log"]
  sink:
    - opensearch:
        hosts: ["https://opensearch:9200"]
        insecure: true
        username: admin
        password: "Str0ng!Passw0rd-2026"
        index: web-logs
        flush_timeout: 5000
curl -s -X POST -H 'Content-Type: application/json' http://localhost:2021/log/ingest -d '[
{"log":"127.0.0.1 - frank [04/Nov/2026:10:00:00 +0100] \"GET /index.html HTTP/1.1\" 200 2326"},
{"log":"10.0.0.8 - alice [04/Nov/2026:10:00:01 +0100] \"GET /admin HTTP/1.1\" 403 120"}
]'The mapping pitfall #
Without an index template, types are guessed. In our test,clientipandbytesended up astext: no network search, no sum possible. Create the template before sending data.
curl -sk -u 'admin:Str0ng!Passw0rd-2026' -H 'Content-Type: application/json' -X PUT https://localhost:9200/_index_template/web_logs -d '{
  "index_patterns": ["web-logs*"],
  "template": {
    "settings": {"number_of_shards": 1, "number_of_replicas": 0},
    "mappings": {"properties": {
      "@timestamp": {"type": "date"},
      "clientip": {"type": "ip"},
      "verb": {"type": "keyword"},
      "request": {"type": "keyword"},
      "response": {"type": "integer"},
      "bytes": {"type": "integer"}
    }}
  }
}'
OpenTelemetry traces #
Data Prepper receives OTLP on dedicated ports: 21890 for traces, 21891 for metrics and 21892 for logs. For traces, two indexes feed the Trace Analytics view of the console. This pipeline comes from the official documentation and we did not run it:
entry-pipeline:
  source:
    otel_trace_source:
      ssl: false
  sink:
    - pipeline:
        name: raw-trace-pipeline
    - pipeline:
        name: service-map-pipeline
raw-trace-pipeline:
  source:
    pipeline:
      name: entry-pipeline
  processor:
    - otel_traces:
  sink:
    - opensearch:
        hosts: ["https://opensearch:9200"]
        insecure: true
        username: admin
        password: "<password>"
        index_type: trace-analytics-raw
service-map-pipeline:
  source:
    pipeline:
      name: entry-pipeline
  processor:
    - service_map:
  sink:
    - opensearch:
        hosts: ["https://opensearch:9200"]
        insecure: true
        username: admin
        password: "<password>"
index_type: trace-analytics-service-mapMy progress
Sign in to track your progress and take notes. Sign in
Recommended Articles
Les Data Sources dans Grafana : Connectez et unifiez vos données
Apprenez à étendre les capacités de Grafana via les Data Sources. Découvrez les plugins essentiel...
Index Lifecycle Management (ILM) : data tiers, rollover et rétention
Automatiser le cycle de vie des index avec ILM : data tiers hot, warm, cold et frozen, rollover p...
Data streams et templates Elasticsearch : component templates, index templates et séries temporelles
Gérer les données horodatées avec les data streams : index templates et component templates, conv...
Bonnes pratiques Logstash : pipelines, performances, fiabilité et supervision
Bonnes pratiques Logstash : pipelines multiples, dissect plutôt que grok, conditionnels, persiste...
OpenTelemetry Collector, Grafana Alloy et Bindplane : comparer trois approches des pipelines de télémétrie
Comparatif détaillé de trois façons de gérer des pipelines de télémétrie : l'OpenTelemetry Collec...
Logs Datadog avancés : index, filtres d'exclusion, Flex Logs, archives et Sensitive Data Scanner
Maîtriser coût et conformité des logs Datadog : pipelines et processeurs, index et rétention, fil...
Kibana avancé : data views, Lens, dashboards, alerting et reporting
Exploiter Kibana en profondeur : data views et champs runtime, Discover, Lens et formules, dashbo...
Kibana : rôle, installation et premiers pas
Ce qu'est Kibana dans la suite Elastic, comment l'installer avec Elasticsearch (start-local, Dock...
Métriques Dynatrace : Data Explorer, sélecteurs de métriques, API et tableaux de bord
Exploiter les métriques dans Dynatrace : métriques intégrées et personnalisées, Data Explorer, sy...