1. Designing good metrics #
Naming and labels.
Conventions #
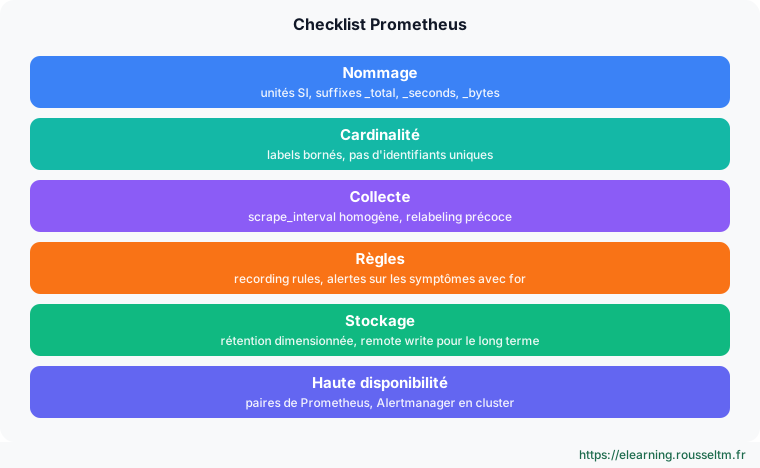
| Rule | Correct example | Example to avoid |
|---|---|---|
| Base units | http_request_duration_seconds | request_time_ms |
Counters ending in _total | http_requests_total | http_requests_count |
| Application prefix | shop_orders_created_total | orders |
| One name, several labels | http_requests_total{method="GET"} | http_get_requests_total |
| Low-cardinality labels | status="500", route="/orders" | user_id="4821", url="/orders/9921" |
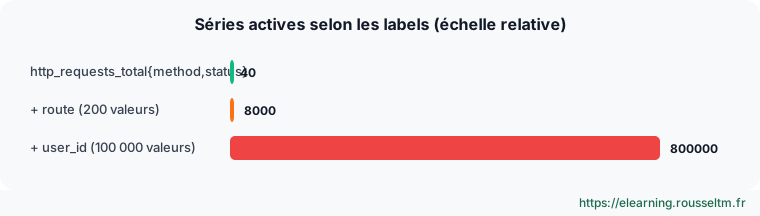
Common mistake: Each unique combination of labels is a time series stored in memory. A label such asuser_idorrequest_idcan multiply the number of series by millions.
Detecting cardinality problems #
# Séries les plus nombreuses par métrique
topk(10, count by (__name__) ({__name__=~".+"}))
prometheus_tsdb_head_series
rate(prometheus_tsdb_head_series_created_total[1h])

curl -s localhost:9090/api/v1/status/tsdb | jq '.data.seriesCountByMetricName[:5]'
promtool tsdb analyze /prometheus | head -40
2. Collection and rules #
Scrape, relabeling and recording rules.
prometheus.yml #
global:
  scrape_interval: 30s          # un seul intervalle commun ; 15 s si nécessaire
  evaluation_interval: 30s
  external_labels: { cluster: prod-eu, replica: A }
scrape_configs:
  - job_name: api
    scrape_timeout: 10s
    sample_limit: 20000                       # protège contre une explosion de séries
    label_limit: 30
    static_configs: [{ targets: ["api-1:8080", "api-2:8080"] }]
    metric_relabel_configs:
      - { source_labels: [__name__], regex: "go_gc_.*|go_memstats_.*", action: drop }   # supprimer le bruit à la source
      - { regex: "session_id", action: labeldrop }
Recording rules #
groups:
  - name: api.rules
    interval: 30s
    rules:
      - record: job:http_requests:rate5m
        expr: sum by (job) (rate(http_requests_total[5m]))
      - record: job:http_errors:ratio_rate5m
        expr: sum by (job) (rate(http_requests_total{status=~"5.."}[5m])) / sum by (job) (rate(http_requests_total[5m]))
promtool check config prometheus.yml && promtool check rules rules/*.yml
curl -s localhost:8080/metrics | promtool check metrics # linter de métriques (nommage)
promtool test rules tests/*.yml3. Useful alerts #
Symptoms rather than causes.
Golden rules #
- Alert on what the user experiences (errors, latency, saturation) rather than on every cause (CPU at 80%).
- Use
for:to avoid alerts on brief spikes; add a description and a link to a runbook. - Each alert must trigger an action: otherwise, delete it or turn it into a dashboard.
- alert: ApiHighErrorRate
  expr: job:http_errors:ratio_rate5m{job="api"} > 0.05
  for: 10m
  labels: { severity: critical, team: backend }
  annotations:
    summary: "Plus de 5 % d'erreurs sur {{ $labels.job }}"
    runbook_url: https://wiki.exemple.fr/runbooks/api-errors
- alert: Watchdog
  expr: vector(1)                          # doit toujours être active : vérifie la chaîne d'alerte
4. Storage, high availability and security #
Operating for the long term.
Sizing and HA #
# espace ≈ rétention (s) × échantillons/s × ~1,5 octet
rate(prometheus_tsdb_head_samples_appended_total[2h])
prometheus --storage.tsdb.retention.time=30d --storage.tsdb.retention.size=200GB --storage.tsdb.wal-compression
du -sh /prometheus; curl -s localhost:9090/api/v1/status/runtimeinfo | jq '.data.storageRetention'- HA: two identical Prometheus servers (different
replicalabel) + clustered Alertmanager; deduplication with Thanos/Mimir. - Long term:
remote_writeto Mimir, Thanos Receive or VictoriaMetrics; short local retention. - Security: TLS and basic authentication via
--web.config.file, admin API disabled if not needed.
# web.yml
tls_server_config: { cert_file: /etc/prometheus/tls.crt, key_file: /etc/prometheus/tls.key }
basic_auth_users: { admin: "$2y$10$..." }
prometheus --web.config.file=/etc/prometheus/web.yml
Reference diagram and quick check #
Visualize the principle and check it from the command line.
Reference diagram #
topk(10, count by (__name__) ({__name__=~".+"}))My progress
Sign in to track your progress and take notes. Sign in
💬 Recent discussions about this course
- Prometheus consomme 12 Go de RAM : comment trouver les métriques coupables ?✓ solved · 2 reply(ies)
- PromQL : quelle différence entre rate() et irate() ?✓ solved · 1 reply(ies)
Ask a question about this lesson →See all discussions about this course
Course Glossary
Alerting
The process of notifying teams (via email, Slack, Teams) when a specific event, threshold breach, or anomaly is detected.
Architecture
The overall structural design of an IT system, defining its various components, their relationships, and the principles guiding its evolution.
OpenTelemetry
An open source framework providing standards, APIs, and SDKs to collect and export observability data (traces, metrics, logs) in an agnostic way.
Recommended Articles
Prometheus recording rules: speeding up your queries and dashboards
Understand and master Prometheus recording rules: evaluation, naming convention, pitfalls (ratios...
Prometheus: alerting with Alertmanager (rules, routing, silences)
Set up Prometheus alerting: alert rules, Alertmanager, routing, grouping, inhibition, silences, S...
Writing good Prometheus alerting rules (and testing them)
Design useful alerts: alert on symptoms, choose for and thresholds, severity and team labels, ann...
PromQL: an introduction to the Prometheus query language
Learn PromQL, the Prometheus query language: selectors, rate, sum by, histograms and first querie...
Measuring SLIs with Prometheus
Implement availability and latency SLIs with Prometheus: required metrics, ratio queries, histogr...
Prometheus: visualizing your metrics (UI, Grafana and dashboards)
Visualize Prometheus data: the web interface, PromQL graphs, connecting to Grafana, RED and USE d...
Metric types in Prometheus
Discover in detail the four metric types supported by Prometheus (Counter, Gauge, Histogram, Summ...
Alerting best practices: Prometheus, Alertmanager and on-call
Checklist for effective alerting: symptom-based rules, severities, routing by team, noise reducti...
Thanos: extending Prometheus (high availability, global view and long retention)
Understand why and how to use Thanos: Prometheus limits, components (Sidecar, Query, Store Gatewa...