1. Services #
Programs that run without a session.
Control a service #
A service is a program started by the service control manager, under an account (LocalSystem, NetworkService, LocalService, a domain account or a group managed service account gMSA). Its startup type is Automatic, Automatic (delayed start), Manual or Disabled.
Get-Service | Where-Object { $_.StartType -eq 'Automatic' -and $_.Status -ne 'Running' }   # services auto arrêtés : suspects
Restart-Service Spooler -Force ; Get-Service Spooler -DependentServices
Set-Service -Name W3SVC -StartupType Automatic
Get-CimInstance Win32_Service -Filter "Name='W3SVC'" | Select-Object Name, StartName, PathName, ProcessId
sc.exe failure MonAppli reset= 86400 actions= restart/60000/restart/60000/none/0    # redémarrage automatique après échec
sc.exe qfailure MonAppli
Good practice: Run applications under a gMSA rather than a regular domain account: its long password is rotated automatically by AD and nobody knows it.
Task Scheduler #
$action  = New-ScheduledTaskAction -Execute 'pwsh.exe' -Argument '-NoProfile -File C:\Scripts\Nettoyer-Logs.ps1 -Dossier D:\Logs'
$trigger = New-ScheduledTaskTrigger -Daily -At 02:30
$princ   = New-ScheduledTaskPrincipal -UserId 'SYSTEM' -LogonType ServiceAccount -RunLevel Highest
Register-ScheduledTask -TaskName 'Nettoyage logs' -TaskPath '\Exploitation\' -Action $action -Trigger $trigger -Principal $princ
Start-ScheduledTask -TaskName 'Nettoyage logs' -TaskPath '\Exploitation\'
Get-ScheduledTask -TaskPath '\Exploitation\' | Get-ScheduledTaskInfo | Select-Object TaskName, LastRunTime, LastTaskResult, NextRunTime
Good to know: LastTaskResult is 0 on success; any other value is the script’s exit code or a scheduler error (0x41301 = running, 0x1 = program failure).2. Event logs #
The system’s memory.
Reading logs with Get-WinEvent #
The main logs are System, Application and Security, plus hundreds of “Applications and Services” logs (Microsoft-Windows-…/Operational). Get-WinEvent with -FilterHashtable filters at the source: much faster than Where-Object.
Get-WinEvent -FilterHashtable @{ LogName = 'System'; Level = 1, 2; StartTime = (Get-Date).AddDays(-1) } |
    Select-Object TimeCreated, Id, ProviderName, Message -First 20
Get-WinEvent -FilterHashtable @{ LogName = 'Security'; Id = 4625; StartTime = (Get-Date).AddHours(-1) } |
    ForEach-Object { $_.Properties[5].Value } | Group-Object | Sort-Object Count -Descending   # comptes visés par des échecs d'ouverture
Get-WinEvent -ListLog * | Where-Object RecordCount -gt 0 | Sort-Object RecordCount -Descending | Select-Object -First 10
wevtutil epl System C:\rapports\system.evtx # exporter un journal pour analyse| ID | Log | Meaning |
|---|---|---|
| 4624 / 4625 | Security | successful / failed logon |
| 4740 | Security (DC) | account locked out |
| 4720 / 4728 | Security (DC) | account created / added to a global security group |
| 7034 / 7036 | System | service terminated unexpectedly / state change |
| 41 / 6008 | System | reboot without clean shutdown (power loss, crash) |
| 1074 | System | shutdown or restart requested (by whom and why) |
| 1000 | Application | application crash (faulting module) |
Good practice: Increase the Security and System log sizes (by GPO), enable advanced audit policy and centralize logs: Windows Event Forwarding (WEF), Azure Monitor or a SIEM. A local log is wiped by an attacker or overwritten in a few hours.
3. Performance #
Measure before concluding.
Counters and method #
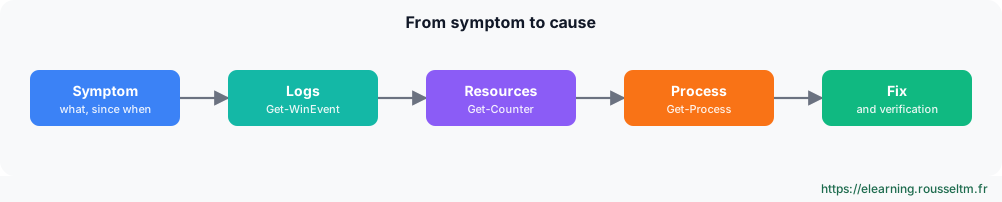
Get-Counter '\Processor(_Total)\% Processor Time', '\Memory\Available MBytes', '\LogicalDisk(_Total)\Avg. Disk sec/Transfer', '\Network Interface(*)\Bytes Total/sec' -SampleInterval 2 -MaxSamples 5
Get-Process | Sort-Object WorkingSet64 -Descending | Select-Object -First 5 Name, Id, @{n='Mo'; e={[int]($_.WorkingSet64/1MB)}}, CPU
logman create counter Perf-Base -c '\Processor(_Total)\% Processor Time' '\Memory\Available MBytes' -si 00:00:15 -o C:\PerfLogs\base
logman start Perf-Base # collecte continue, à analyser dans perfmon| Resource | Counter | Indicative alert threshold |
|---|---|---|
| CPU | % Processor Time | > 85% sustained |
| Memory | Available MBytes | < 10% of RAM |
| Disk | Avg. Disk sec/Transfer | > 20 ms (HDD), > 5 ms (SSD) |
| Network | Bytes Total/sec | > 70% of adapter bandwidth |
Graphical tools: Task Manager, Resource Monitor (resmon) to see which process uses which file or port, Performance Monitor (perfmon) for data collection, and Reliability Monitor (perfmon /rel) for the history of crashes and installations.
Commands to know #
| Action | Command |
|---|---|
| Stopped automatic services | Get-Service | Where-Object { $_.StartType -eq 'Automatic' -and $_.Status -ne 'Running' } |
| Restart a service | Restart-Service W3SVC |
| Failure recovery | sc.exe failure MonAppli reset= 86400 actions= restart/60000 |
| Create a scheduled task | Register-ScheduledTask -TaskName Sauvegarde -Action $a -Trigger $t |
| System errors of the last 24 h | Get-WinEvent -FilterHashtable @{LogName='System'; Level=2; StartTime=(Get-Date).AddDays(-1)} |
| Failed logons | Get-WinEvent -FilterHashtable @{LogName='Security'; Id=4625} -MaxEvents 20 |
| Performance counters | Get-Counter '\Processor(_Total)\% Processor Time' -Continuous |
| Reliability Monitor | perfmon /rel |
My progress
Sign in to track your progress and take notes. Sign in
💬 Questions about this lesson
No questions yet: be the first to ask for help or share your configuration.
Recommended Articles
Users, groups, NTFS permissions and SMB shares
Manage local accounts and groups, understand UAC, apply NTFS permissions with inheritance, create...
Group Policy (GPO): configuring the estate from Active Directory
Design and troubleshoot Group Policy: computer and user configuration, OU linking, LSDOU order, i...
Processes, memory and performance: monitoring and troubleshooting a Linux server
Understand and control Linux processes (ps, top, signals, nice, jobs), interpret load, memory and...
Linux administration best practices
Checklist for administering Linux servers: accounts and sudo, SSH, updates, systemd services, sto...
Linux server security and hardening
Harden a Linux server: least privilege, updates, secure SSH, firewall, fail2ban, SELinux and AppA...
Backup, monitoring and troubleshooting of a Linux server
Operate a Linux server day to day: 3-2-1 backup strategy with rsync, tar, LVM snapshots and resti...
Monitoring and protecting Azure: Monitor, Log Analytics, Defender, Key Vault and Backup
Operate Azure: Azure Monitor (metrics, activity logs, alerts), Log Analytics and KQL, Application...
Measuring DevOps performance: DORA metrics, SPACE and continuous improvement
Measure and improve delivery performance: the DORA metrics (deployment frequency, lead time, chan...
Kubernetes Services: ClusterIP, NodePort, LoadBalancer and ExternalName
Kubernetes Services explained: the role of a Kubernetes service, the ClusterIP, NodePort, LoadBal...