1. The project #
One application, all the courses.
Goal #
Available in: ✓ OSS ✓ Enterprise ✓ Cloud
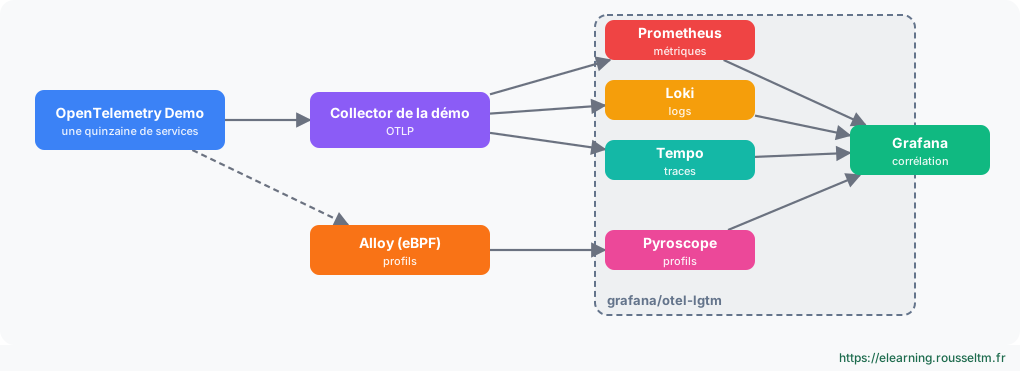
The OpenTelemetry Demo is an online shop made of about fifteen microservices written in about ten languages, already instrumented with OpenTelemetry, with a load generator and failures that can be enabled through feature flags. This project connects it to the Grafana stack to practice, on a single application, what each course teaches.
| Step | Signal | Related courses |
|---|---|---|
| 1 | Deploy the demo and the stack | OpenTelemetry, Docker |
| 2 | Metrics in Prometheus | Prometheus, Grafana, Mimir |
| 3 | Traces in Tempo | Tempo, Jaeger |
| 4 | Logs in Loki | Loki, Alloy |
| 5 | Profiles in Pyroscope | Pyroscope, eBPF |
| 6 | Diagnose an injected failure | SRE, Alertmanager |
2. Setting up #
The demo and the stack.
Starting #
git clone --depth 1 https://github.com/open-telemetry/opentelemetry-demo.git
cd opentelemetry-demo
docker compose up --force-recreate --remove-orphans --detach
# Boutique : http://localhost:8080   Générateur de charge : http://localhost:8080/loadgen/
# Feature flags : http://localhost:8080/feature
# Stack Grafana tout-en-un dans le réseau de la démo
docker run -d --name lgtm --network opentelemetry-demo -p 3001:3000 grafana/otel-lgtm
# Grafana du fil rouge : http://localhost:3001 (admin / admin)Good to know: The name of the demo's Docker network may vary between versions: docker network ls shows it.Connecting the demo's Collector #
The demo provides a src/otel-collector/otelcol-config-extras.yml file merged with its configuration. Add an exporter to lgtm there and add it to the three pipelines:
exporters:
  otlphttp/lgtm:
    endpoint: http://lgtm:4318

service:
  pipelines:
    traces:
      exporters: [otlp, debug, spanmetrics, otlphttp/lgtm]
    metrics:
      exporters: [otlphttp/prometheus, debug, otlphttp/lgtm]
    logs:
      exporters: [opensearch, debug, otlphttp/lgtm]
Common mistake: The exporter lists replace those of the main file: copy exactly the existing exporters fromotelcol-config.yml(they vary between versions) and addotlphttp/lgtm.
docker compose restart otel-collector3. The four signals #
Checking each chain.
Metrics, traces, logs #
# Prometheus (dans Grafana > Explore)
sum by (service_name) (rate(traces_span_metrics_calls_total[5m]))
histogram_quantile(0.95, sum by (le, service_name) (rate(traces_span_metrics_duration_milliseconds_bucket[5m])))
# Tempo : traces en erreur du service checkout
{ resource.service.name = "checkout" && status = error }# Loki : logs d'erreur, avec le lien vers la trace
{service_name="checkout"} |= "error" Good to know: The exact names of span-derived metrics depend on the configuration of the demo's spanmetrics connector: Grafana's metrics browser lists them.Profiles #
The demo does not send profiles by default. A privileged Alloy with pyroscope.ebpf (see the Pyroscope and eBPF courses) profiles all its containers and sends to the lgtm Pyroscope (port 4040).
docker run -d --name alloy-ebpf --network opentelemetry-demo --privileged --pid host \
  -v /var/run/docker.sock:/var/run/docker.sock -v $PWD/profils.alloy:/etc/alloy/config.alloy \
  grafana/alloy:latest run /etc/alloy/config.alloy
4. Diagnosing an injected failure #
The final scenario.
Method #
- Enable a failure in the feature flags interface (for example a product catalog failure or high CPU usage in a service).
- Metrics: spot the service whose error rate or latency breaks down (RED dashboard).
- Traces: open an error trace from this service and identify the faulty span.
- Logs: from the span, open the associated logs (link by trace_id).
- Profiles: for a CPU failure, open the service's flame graph over the period.
- Alerting: write the burn rate rule that would have detected the failure (SRE course) and test it by re-enabling the flag.
Good practice: Time the interval between enabling the failure and identifying the cause: this is the indicator to bring down by improving dashboards, links between signals and alerts.
