1. Overview #
AWS observability building blocks and their role.
An offering built around CloudWatch #
On AWS, observability revolves around Amazon CloudWatch (metrics, logs, alarms, dashboards and many specialized features), complemented by AWS X-Ray for traces, Amazon Managed Service for Prometheus (AMP) for Prometheus-format metrics, Amazon Managed Grafana for visualization and Amazon OpenSearch Service for large-scale log search.
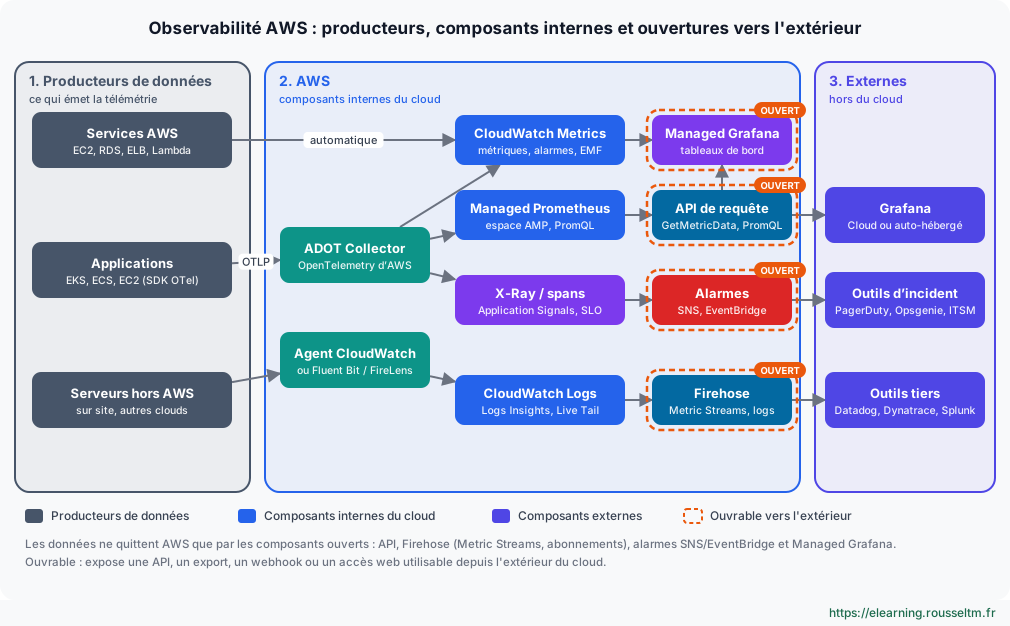
Good to know: CloudWatch automatically collects the basic metrics of most managed services (EC2, RDS, ELB, Lambda…) without an agent. The agent or ADOT is only needed for guest operating system metrics (memory, disk), application logs and traces.
Supported pillars #
| Pillar | AWS service | Language / exploration | OpenTelemetry |
|---|---|---|---|
| Metrics | CloudWatch Metrics, Managed Service for Prometheus | Metric Insights (SQL), PromQL | ✅ Yes (ADOT: EMF, remote write) |
| Logs | CloudWatch Logs, OpenSearch Service | Logs Insights (QL, SQL, PPL), Live Tail | ✅ Yes (ADOT, OTLP endpoint) |
| Traces | AWS X-Ray, Transaction Search, Application Signals | Trace queries, service map | ✅ Yes (OTLP to X-Ray) |
| Profiles | Amazon CodeGuru Profiler (Java, Python) | Flame graphs | 🟡 Partial (check availability; Pyroscope as an alternative) |
| RUM and synthetic | CloudWatch RUM, CloudWatch Synthetics (canaries) | Dedicated dashboards | 🟡 Partial |
| Events | EventBridge, CloudTrail (audit) | CloudTrail Lake (SQL) | ❌ No |
Watch out: Profiles remain the least natively covered pillar: AWS has reduced its investment in CodeGuru. For continuous profiling, many teams use Grafana Pyroscope or the profiling solution of their APM tool.
2. The components in detail #
What each service does and when to use it.
CloudWatch Metrics and alarms #
Metrics are organized by namespace (AWS/EC2, AWS/Lambda…), name and dimensions. Standard resolution is one minute; high-resolution metrics go down to one second. Alarms evaluate a metric or an expression (metric math) and trigger an SNS notification, an Auto Scaling or an EC2 action. Composite alarms combine several alarms to reduce noise, and anomaly detection computes a band of expected values.
aws cloudwatch put-metric-alarm --alarm-name api-5xx \
  --namespace AWS/ApplicationELB --metric-name HTTPCode_Target_5XX_Count \
  --dimensions Name=LoadBalancer,Value=app/api/123abc \
  --statistic Sum --period 60 --evaluation-periods 5 --datapoints-to-alarm 3 \
  --threshold 10 --comparison-operator GreaterThanThreshold \
  --alarm-actions arn:aws:sns:eu-west-3:111122223333:astreinte
The Embedded Metric Format (EMF) lets you write metrics into a structured JSON log: CloudWatch extracts them automatically, which is ideal for Lambda.
CloudWatch Logs #
Logs are organized into groups and streams, with a retention configurable per group. Logs Insights queries logs with its own query language (as well as SQL and PPL depending on versions), Live Tail follows them live, metric filters turn patterns into metrics and the Infrequent Access class lowers the cost of rarely queried logs. Data protection automatically masks sensitive data.
aws logs start-query --log-group-name /aws/lambda/commande \
  --start-time $(date -d '-1 hour' +%s) --end-time $(date +%s) \
  --query-string 'fields @timestamp, @message | filter level = "ERROR" | stats count() by bin(5m)'
Traces: X-Ray, Transaction Search and Application Signals #
AWS X-Ray receives segments and spans, builds a service map and lets you analyze traces. Transaction Search now stores all spans in CloudWatch Logs (group aws/spans) so they can be searched and aggregated. CloudWatch Application Signals provides an APM view: automatically discovered services, RED metrics (volume, errors, latency), dependencies and SLOs with error budgets, based on OpenTelemetry instrumentation (ADOT).
Good practice: Enable Application Signals on EKS, ECS, EC2 or Lambda to get a per-service dashboard within minutes and define SLOs directly in CloudWatch.
Specialized CloudWatch features #
| Feature | Role |
|---|---|
| Container Insights | Metrics and logs of EKS, ECS and Kubernetes clusters (with enhanced observability on EKS) |
| Lambda Insights | System metrics of functions (memory, duration, cold starts) |
| Database Insights | Load and query analysis of RDS and Aurora databases |
| CloudWatch RUM | Real web user experience: Core Web Vitals, JavaScript errors, sessions |
| CloudWatch Synthetics | Canaries (Node.js or Python scripts) that continuously test journeys and APIs |
| Internet Monitor, Network Flow Monitor | Network availability and performance toward users and between resources |
| Contributor Insights | Ranking of top contributors (IPs, clients) from logs |
| Investigations | Investigation assistant that correlates metrics, logs, traces and changes during an incident |
Managed Prometheus, Managed Grafana and OpenSearch #
Amazon Managed Service for Prometheus stores Prometheus metrics with no servers to manage: you write to it by remote write (Prometheus, ADOT, Grafana Alloy) or with its managed scrapers for EKS, then query it in PromQL. Amazon Managed Grafana provides Grafana workspaces with IAM Identity Center or SAML authentication and CloudWatch, X-Ray, AMP, OpenSearch, Athena and partner data sources. OpenSearch Service is used for log and trace analysis with OpenSearch Dashboards.
3. Detailed sheet for each component #
Role, content, data types, retention and internal and external interactions of each building block in the diagram.
Summary view #
The following table summarizes each component of the architecture diagram; the sheets that follow detail them one by one.
| Component | Zone | Signals | Can be opened to the outside |
|---|---|---|---|
| ADOT Collector | Collection | Metrics, traces, logs | 🔒 No (internal) |
| CloudWatch agent / Fluent Bit | Collection | System metrics, logs | 🔒 No (internal) |
| CloudWatch Metrics | Storage | Metrics | 🟡 Indirectly |
| Managed Prometheus | Storage | Prometheus metrics | 🟡 Indirectly |
| X-Ray / Application Signals | Storage and APM | Traces, RED metrics, SLOs | 🟡 Indirectly |
| CloudWatch Logs | Storage | Logs, spans | 🟡 Indirectly |
| Managed Grafana | Output | Visualization | 🟠 Yes |
| Query APIs | Output | All | 🟠 Yes |
| Alarms (SNS, EventBridge) | Output | Events | 🟠 Yes |
| Firehose | Output | Streamed metrics and logs | 🟠 Yes |
Indicative values: Retention periods, limits and pricing models change regularly: check them in the official documentation before sizing an architecture.
ADOT Collector (AWS Distro for OpenTelemetry) #
The ADOT collector is the distribution of the OpenTelemetry collector maintained by AWS: it receives telemetry from applications, enriches it and exports it to AWS services.
| Characteristic | Detail |
|---|---|
| Role | Receive, process (batching, sampling, resource enrichment) and route OpenTelemetry traces, metrics and logs. |
| Content | Receivers otlp, prometheus, awsecscontainermetrics; processors batch, resourcedetection; exporters awsemf, awsxray, prometheusremotewrite, awscloudwatchlogs; extension sigv4auth. |
| Data type | OTLP (gRPC 4317, HTTP 4318), Prometheus format, EMF as output to CloudWatch. |
| Storage and retention | No durable storage: in-memory send queues (or on disk with file_storage). |
| Inputs (internal components) | Instrumented applications (OpenTelemetry SDKs, Java, Python, .NET, Node.js agents), Prometheus targets. |
| Outputs (internal components) | CloudWatch Metrics (EMF), Managed Prometheus (remote write), X-Ray (traces), CloudWatch Logs. |
| External interactions | Can also export directly to a third-party OTLP-compatible back end (Datadog, Dynatrace, Grafana Cloud…). |
| Can be opened to the outside | 🔒 No (internal): it only sends data outside if a third-party exporter is added. |
| Security and access | IAM role of the ECS task, the EKS pod (IRSA or Pod Identity) or the instance; SigV4 signing of calls. |
| Cost | Free; you pay for the compute that hosts it and for the destination services. |
Good to know: Deployment: EKS add-on, ECS sidecar container, Lambda layer or service on EC2.
CloudWatch agent and Fluent Bit (FireLens) #
The CloudWatch agent collects what the platform cannot see from outside a machine; Fluent Bit, often through FireLens on ECS, ships container logs.
| Characteristic | Detail |
|---|---|
| Role | Collect guest system metrics (memory, disk, processes), log files, StatsD/collectd metrics; feed Container Insights and Application Signals. |
| Content | JSON configuration (often stored in Systems Manager Parameter Store); for Fluent Bit, inputs, filters and outputs (cloudwatch_logs, kinesis_firehose, opensearch). |
| Data type | Metrics (CloudWatch), text or JSON logs. |
| Storage and retention | None: local buffers. |
| Inputs (internal components) | EC2 servers, on-premises or other cloud servers, ECS/EKS containers. |
| Outputs (internal components) | CloudWatch Metrics, CloudWatch Logs. |
| External interactions | Fluent Bit can also send directly to Splunk, Datadog, Elastic, Loki or an HTTP output. |
| Can be opened to the outside | 🔒 No (internal) |
| Security and access | IAM role with CloudWatchAgentServerPolicy; access keys or IAM Roles Anywhere for servers outside AWS. |
| Cost | Free; custom metrics and log ingestion are billed. |
CloudWatch Metrics #
The AWS time series store: every service publishes its metrics there, and applications can add their own.
| Characteristic | Detail |
|---|---|
| Role | Store, aggregate and make metrics queryable; the basis of alarms, dashboards and autoscaling. |
| Content | Metrics identified by namespace, name and up to 30 dimensions; statistics (Sum, Average, p99…), metric math, Metrics Insights (SQL), anomaly detection. |
| Data type | Timestamped numeric data points; standard resolution 1 minute, high resolution down to 1 second. |
| Storage and retention | Sub-minute data points kept 3 hours, 1-minute for 15 days, 5-minute for 63 days, 1-hour for 455 days (15 months). |
| Inputs (internal components) | AWS services (automatic), CloudWatch agent, ADOT (EMF), PutMetricData, log metric filters. |
| Outputs (internal components) | Alarms, CloudWatch dashboards, Managed Grafana, Metric Streams. |
| External interactions | Read by Datadog, Dynatrace, New Relic through the API (read role) or pushed through Metric Streams and Firehose. |
| Can be opened to the outside | 🟡 Indirectly: through the query API and Metric Streams. |
| Security and access | IAM policies (cloudwatch:GetMetricData, PutMetricData); cross-account observability. |
| Cost | Basic metrics free; custom metrics, API calls and alarms billed. |
Amazon Managed Service for Prometheus (AMP) #
A Prometheus back end with no servers to manage, PromQL-compatible.
| Characteristic | Detail |
|---|---|
| Role | Store Prometheus-format metrics at scale, especially those of Kubernetes clusters. |
| Content | Workspaces, recording and alerting rules, Alertmanager-compatible alert manager, managed collectors (scrapers) for EKS. |
| Data type | Prometheus time series (key-value labels). |
| Storage and retention | 150-day retention by default, configurable. |
| Inputs (internal components) | Remote write from ADOT, Prometheus, Grafana Alloy; managed scrapers. |
| Outputs (internal components) | PromQL API, Managed Grafana; alerts to SNS. |
| External interactions | Any PromQL-compatible application (self-hosted Grafana, in-house tools) can query it with SigV4. |
| Can be opened to the outside | 🟡 Indirectly: through its PromQL query API. |
| Security and access | IAM (aps:RemoteWrite, aps:QueryMetrics) and SigV4 signing; VPC endpoints available. |
| Cost | Samples ingested, stored and queried. |
AWS X-Ray, Transaction Search and Application Signals #
The AWS traces and APM building block, now integrated into CloudWatch.
| Characteristic | Detail |
|---|---|
| Role | Receive spans, rebuild traces and the service map, compute RED metrics and track service SLOs. |
| Content | Segments and subsegments (or OpenTelemetry spans), sampling rules, service map, Transaction Search (indexed spans), Application Signals (services, operations, dependencies, SLOs). |
| Data type | Traces and spans, derived metrics (volume, errors, latency). |
| Storage and retention | Traces kept 30 days; with Transaction Search, spans are stored in CloudWatch Logs (group aws/spans) according to its retention. |
| Inputs (internal components) | ADOT and CloudWatch agent (OTLP), X-Ray SDK, automatically instrumented services (Lambda, API Gateway). |
| Outputs (internal components) | CloudWatch console, SLO alarms, Managed Grafana (X-Ray data source). |
| External interactions | OpenTelemetry traces can be sent in parallel to a third-party APM by the collector. |
| Can be opened to the outside | 🟡 Indirectly: through the X-Ray API (GetTraceSummaries, BatchGetTraces). |
| Security and access | IAM (xray:PutTraceSegments, xray:GetTraceSummaries). |
| Cost | Traces recorded and retrieved; Application Signals and Transaction Search billed by volume. |
CloudWatch Logs #
The central log store on AWS.
| Characteristic | Detail |
|---|---|
| Role | Receive, retain, search and analyze logs; turn them into metrics or stream them to other systems. |
| Content | Log groups and streams, Logs Insights, Live Tail, metric filters, subscription filters, sensitive data protection, Standard and Infrequent Access classes. |
| Data type | Timestamped log events (text or JSON); « vended » logs from services (VPC Flow Logs, Route 53, API Gateway…). |
| Storage and retention | Retention per group, from 1 day to 10 years, or unlimited (the default); one-off export to S3. |
| Inputs (internal components) | CloudWatch agent, Fluent Bit, Lambda (automatic), AWS services, ADOT. |
| Outputs (internal components) | Subscription filters to Firehose, Kinesis, Lambda or OpenSearch; metrics through metric filters. |
| External interactions | Streaming to Splunk, Datadog, Elastic through Firehose; API queries from a third-party tool. |
| Can be opened to the outside | 🟡 Indirectly: through subscription filters (via Firehose) and the API. |
| Security and access | IAM per log group; KMS encryption available. |
| Cost | Ingestion (the largest item), storage and Logs Insights queries. |
Amazon Managed Grafana #
Grafana workspaces fully managed by AWS.
| Characteristic | Detail |
|---|---|
| Role | Visualize and correlate all sources: dashboards, explorations, Grafana alerts. |
| Content | Workspaces, data sources (CloudWatch, X-Ray, AMP, OpenSearch, Athena, Timestream, Enterprise plugins), dashboards, alerts. |
| Data type | Stores no telemetry: queries sources on demand. |
| Storage and retention | Dashboards and configuration only. |
| Inputs (internal components) | CloudWatch Metrics, Managed Prometheus, X-Ray, CloudWatch Logs. |
| Outputs (internal components) | Grafana alert notifications (SNS, Slack, PagerDuty…). |
| External interactions | Can also query external sources (Datadog, Splunk, self-hosted Prometheus) with the appropriate plugins. |
| Can be opened to the outside | 🟠 Yes: web interface accessible to authenticated users, Grafana API. |
| Security and access | IAM Identity Center or SAML; Grafana roles; public or VPC network access. |
| Cost | Per active user (editor or viewer). |
Query APIs (CloudWatch, Logs, X-Ray, AMP) #
All AWS observability data is accessible through APIs: this is the main « read » exit.
| Characteristic | Detail |
|---|---|
| Role | Let tools, scripts or dashboards query metrics, logs and traces. |
| Content | GetMetricData and ListMetrics (CloudWatch), StartQuery and GetQueryResults (Logs Insights), GetTraceSummaries and BatchGetTraces (X-Ray), Prometheus HTTP API (AMP). |
| Data type | JSON responses (series, log lines, traces). |
| Inputs (internal components) | CloudWatch Metrics, CloudWatch Logs, X-Ray, Managed Prometheus. |
| Outputs (internal components) | Managed Grafana and any authorized client. |
| External interactions | Self-hosted Grafana, Datadog, Dynatrace, New Relic (polling), scripts and in-house tools. |
| Can be opened to the outside | 🟠 Yes: public endpoints of AWS services (or VPC endpoints). |
| Security and access | SigV4 signing with IAM credentials; least privilege principle (read-only role). |
| Cost | Billed per request (GetMetricData, Logs Insights queries per GB scanned). |
Good to know: For a third-party tool, prefer Metric Streams to periodic polling: lower latency and no GetMetricData call costs.
CloudWatch alarms, SNS and EventBridge #
The chain that turns a condition on the data into an action or a notification.
| Characteristic | Detail |
|---|---|
| Role | Evaluate thresholds, anomalies or SLOs and trigger actions. |
| Content | Metric alarms, composite alarms, anomaly detection alarms, SLO alarms (Application Signals); OK, ALARM, INSUFFICIENT_DATA states. |
| Data type | State change events. |
| Inputs (internal components) | CloudWatch Metrics, Application Signals metrics, Managed Prometheus alerting rules. |
| Outputs (internal components) | Auto Scaling, EC2 and Systems Manager actions (OpsItems, incidents). |
| External interactions | SNS (email, SMS, HTTPS, Lambda), EventBridge to PagerDuty, Opsgenie, ServiceNow, webhooks; Amazon Q Developer in Slack or Teams. |
| Can be opened to the outside | 🟠 Yes: outgoing notifications and events. |
| Security and access | SNS topic policies and EventBridge rules; KMS encryption of topics. |
| Cost | Per alarm and per notification. |
Amazon Data Firehose (Metric Streams and subscriptions) #
The streaming delivery service that moves metrics and logs out of AWS to other tools.
| Characteristic | Detail |
|---|---|
| Role | Deliver telemetry streams to a destination in near real time, with buffering, transformation and retry on error. |
| Content | Delivery streams, buffers (size or duration), Lambda transformation, backup of failures to S3. |
| Data type | CloudWatch metrics (JSON or OpenTelemetry format) from Metric Streams; log events from subscription filters. |
| Storage and retention | No durable storage (buffers); optional copy to S3. |
| Inputs (internal components) | CloudWatch Metric Streams, CloudWatch Logs subscription filters. |
| Outputs (internal components) | S3, OpenSearch Service, Redshift. |
| External interactions | HTTP endpoints of Datadog, Dynatrace, New Relic, Elastic, Sumo Logic; Splunk (HEC). |
| Can be opened to the outside | 🟠 Yes: it is the main continuous export channel. |
| Security and access | Delivery IAM role; destination API key stored in Secrets Manager. |
| Cost | Volume of data processed (and metrics streamed for Metric Streams). |
4. OpenTelemetry compatibility #
ADOT, OTLP endpoints and collector configuration.
AWS Distro for OpenTelemetry (ADOT) #
ADOT is the OpenTelemetry distribution maintained by AWS: collector, SDKs and automatic instrumentation agents (Java, Python, .NET, Node.js) with AWS components (EC2, ECS, EKS, Lambda resource detectors, awsemf and awsxray exporters, sigv4auth authentication). It is available as an EKS add-on, a Lambda layer and a container image.
CloudWatch also exposes OTLP endpoints for traces (X-Ray) and logs: a standard OpenTelemetry collector can send its data there over OTLP/HTTP, signed with SigV4.
extensions:
  sigv4auth:
    region: eu-west-3
    service: aps
receivers:
  otlp:
    protocols: { grpc: {}, http: {} }
processors:
  batch: {}
  resourcedetection: { detectors: [env, eks, ec2] }
exporters:
  awsemf:                      # métriques vers CloudWatch (Embedded Metric Format)
    namespace: Boutique
  awsxray: {}                  # traces vers X-Ray
  prometheusremotewrite:       # métriques vers Managed Prometheus
    endpoint: https://aps-workspaces.eu-west-3.amazonaws.com/workspaces/ws-1234/api/v1/remote_write
    auth: { authenticator: sigv4auth }
service:
  extensions: [sigv4auth]
  pipelines:
    traces:  { receivers: [otlp], processors: [resourcedetection, batch], exporters: [awsxray] }
    metrics: { receivers: [otlp], processors: [resourcedetection, batch], exporters: [awsemf, prometheusremotewrite] }
Good to know: OpenTelemetry SDKs can be used as is: for X-Ray, add the X-Ray ID generator and propagator only if you must interoperate with older services instrumented with the X-Ray SDK; otherwise W3C context is enough.
5. Interconnections with external products #
Sending AWS data to other tools and vice versa.
Exporting from AWS #
| Mechanism | Data | Typical destinations |
|---|---|---|
| CloudWatch Metric Streams | Continuous CloudWatch metrics (JSON or OpenTelemetry 1.0) | Kinesis Data Firehose to Datadog, Dynatrace, New Relic, Splunk, Elastic, S3 |
| Log subscription filters | Log events | Firehose, Lambda, Kinesis, OpenSearch; then Splunk, Datadog, Elastic… |
| IAM role integrations | Metrics, tags, inventory | Datadog, Dynatrace, New Relic query the CloudWatch APIs with a read role |
| Managed Grafana | All AWS sources | Shared dashboards with Prometheus, Loki, Splunk, Datadog (plugins) |
| EventBridge | State changes, alarms | Incident tools (PagerDuty, Opsgenie), ITSM, webhooks |
Good practice: Prefer Metric Streams to API polling to send metrics to a third-party tool: latency drops from several minutes to a few seconds and the cost of GetMetricData calls disappears.
Centralizing several accounts #
CloudWatch cross-account observability (Observability Access Manager) links source accounts to a monitoring account: metrics, logs, traces and Application Signals can be viewed there without copying data. Combined with AWS Organizations, it provides a single view of the whole organization.
6. Costs and best practices #
Controlling the bill and making observability useful.
Best practices #
- Set a retention per log group (the default is « never expire »).
- Limit the cardinality of custom dimensions: each combination is a billed metric.
- Instrument with OpenTelemetry (ADOT) to stay portable to other back ends.
- Use composite alarms and anomaly detection to reduce noise.
- Sample traces (X-Ray sampling rules or tail sampling in the collector).
- Enable cross-account observability and tag resources to allocate costs.
Common mistake: Logs are often the largest cost item: ingesting all debug logs in production can cost more than the servers themselves.
