1. Overview #
The Google Cloud Observability suite.
The services in the suite #
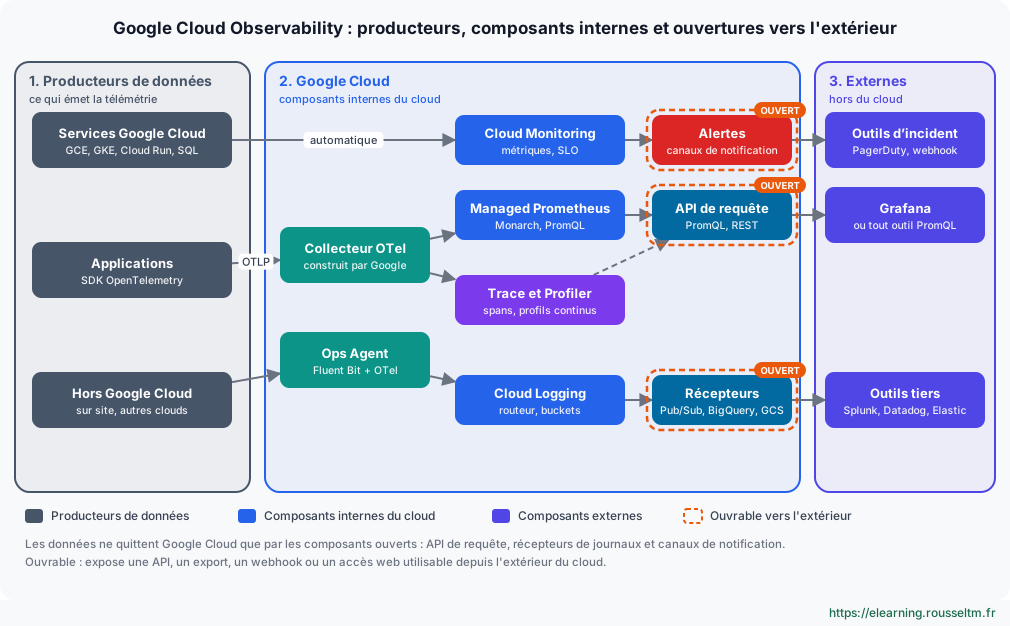
Google Cloud Observability (formerly Stackdriver, then operations suite) brings together Cloud Monitoring, Cloud Logging, Cloud Trace, Cloud Profiler and Error Reporting, as well as Google Cloud Managed Service for Prometheus, built on Monarch, Google's internal time series database. Metrics for most managed services are collected automatically; platform logs and audit logs arrive in Cloud Logging with no configuration.
Supported pillars #
| Pillar | Service | Exploration | OpenTelemetry |
|---|---|---|---|
| Metrics | Cloud Monitoring, Managed Service for Prometheus | Metrics Explorer, PromQL | ✅ Yes |
| Logs | Cloud Logging (buckets, Log Analytics) | Logging query language, SQL (BigQuery) | ✅ Yes (collector, Ops Agent) |
| Traces | Cloud Trace | Trace Explorer | ✅ Yes (OTLP through the Telemetry API) |
| Profiles | Cloud Profiler (Go, Java, Node.js, Python) | Flame graphs, comparisons | 🟡 Partial (Google-specific Profiler agent) |
| Errors | Error Reporting | Exception grouping | 🟡 Partial |
| Synthetic | Uptime checks, synthetic monitors | Cloud Monitoring | 🟡 Partial |
Good to know: Google Cloud is one of the few clouds to natively offer all four pillars, profiles included, with Cloud Profiler and its low production overhead.
2. The components in detail #
Role of each service.
Cloud Monitoring #
Cloud Monitoring stores system and custom metrics, and offers the Metrics Explorer, dashboards, uptime checks and synthetic monitors, alerting policies (legacy MQL, PromQL now recommended) and SLO monitoring with error budgets and burn rate alerts. Scoping projects (metrics scopes) group metrics from several projects.
gcloud monitoring uptime create api-boutique \
  --resource-type=uptime-url --resource-labels=host=api.exemple.fr,project_id=boutique-prod \
  --path=/healthz --period=1
Cloud Logging #
All logs go through the log router: sinks send them to log buckets (configurable retention), BigQuery, Cloud Storage or Pub/Sub; exclusion filters avoid ingesting what is useless. Log Analytics lets you query upgraded buckets in SQL, with linked BigQuery datasets. Log-based metrics turn patterns into alerting metrics.
gcloud logging sinks create vers-bigquery \
  bigquery.googleapis.com/projects/boutique-prod/datasets/journaux \
  --log-filter='resource.type="cloud_run_revision" AND severity>=WARNING' --use-partitioned-tables
Cloud Trace, Cloud Profiler and Error Reporting #
Cloud Trace stores and analyzes spans (latency, call map, reports). Cloud Profiler continuously collects CPU and memory profiles with very low overhead and compares versions. Error Reporting automatically groups exceptions detected in logs and notifies about new errors.
Ops Agent and collection on Kubernetes #
On Compute Engine, the Ops Agent (based on Fluent Bit for logs and the OpenTelemetry Collector for metrics) collects system metrics and logs, with third-party integrations (NGINX, PostgreSQL…). On GKE, collection of logs and system metrics is built in, and Managed Prometheus collects application metrics with PodMonitoring resources.
apiVersion: monitoring.googleapis.com/v1
kind: PodMonitoring
metadata: { name: api, namespace: boutique }
spec:
  selector: { matchLabels: { app: api } }
  endpoints:
  - port: metrics
    interval: 30s
3. Detailed sheet for each component #
Role, content, data types, retention and internal and external interactions of each building block in the diagram.
Summary view #
The following table summarizes each component of the architecture diagram; the sheets that follow detail them one by one.
| Component | Zone | Signals | Can be opened to the outside |
|---|---|---|---|
| Google OpenTelemetry Collector | Collection | Metrics, traces, logs | 🔒 No (internal) |
| Ops Agent | Collection | System metrics, logs | 🔒 No (internal) |
| Cloud Monitoring | Storage | Metrics, SLOs | 🟡 Indirectly |
| Managed Service for Prometheus | Storage | Prometheus metrics | 🟡 Indirectly |
| Cloud Logging | Storage | Logs, audit | 🟡 Indirectly |
| Cloud Trace | Storage | Traces | 🟡 Indirectly |
| Cloud Profiler | Storage | Profiles | 🔒 No (internal) |
| Error Reporting | Analysis | Errors | 🔒 No (internal) |
| Alerts and notification channels | Output | Events | 🟠 Yes |
| Query APIs | Output | All | 🟠 Yes |
| Log sinks | Output | Streamed logs | 🟠 Yes |
Indicative values: Retention periods, limits and pricing models change regularly: check them in the official documentation before sizing an architecture.
Google-Built OpenTelemetry Collector #
The distribution of the OpenTelemetry Collector published and supported by Google.
| Characteristic | Detail |
|---|---|
| Role | Receive OpenTelemetry telemetry from applications and send it to Google Cloud Observability services. |
| Content | OTLP and Prometheus receivers, processors (batching, GCP resource detection, filtering), googlecloud and googlemanagedprometheus exporters, OTLP export to the Telemetry API. |
| Data type | OTLP (traces, metrics, logs), Prometheus metrics. |
| Storage and retention | None: send queues. |
| Inputs (internal components) | Instrumented applications on GKE, Compute Engine, Cloud Run or outside Google Cloud. |
| Outputs (internal components) | Cloud Trace, Managed Service for Prometheus, Cloud Logging, Cloud Monitoring. |
| External interactions | Can duplicate data to a third-party OTLP back end. |
| Can be opened to the outside | 🔒 No (internal) |
| Security and access | Service account (Workload Identity on GKE) with write roles (Monitoring Metric Writer, Logs Writer, Cloud Trace Agent). |
| Cost | Free; you pay for hosting and ingestion. |
Ops Agent #
The Compute Engine agent that combines Fluent Bit (logs) and the OpenTelemetry Collector (metrics).
| Characteristic | Detail |
|---|---|
| Role | Collect system and application metrics and logs from VMs. |
| Content | /etc/google-cloud-ops-agent/config.yaml file; third-party integrations (NGINX, Apache, PostgreSQL, MySQL, Redis…); deployment through VM Manager policies. |
| Data type | Metrics (CPU, memory, disk, network, processes), system and application logs. |
| Storage and retention | None: local buffer. |
| Inputs (internal components) | Compute Engine VMs (and servers outside Google Cloud with suitable configuration). |
| Outputs (internal components) | Cloud Monitoring, Cloud Logging. |
| External interactions | None directly. |
| Can be opened to the outside | 🔒 No (internal) |
| Security and access | VM service account with Logs Writer and Monitoring Metric Writer roles. |
| Cost | Free; ingestion billed. |
Cloud Monitoring #
Google Cloud's metrics, dashboards, uptime checks and SLO service, backed by Monarch.
| Characteristic | Detail |
|---|---|
| Role | Store and query metrics, drive alerts and SLOs, group projects in a metrics scope. |
| Content | Google Cloud system metrics, agent, custom, log-based and Prometheus metrics; Metrics Explorer; dashboards; uptime checks and synthetic monitors; SLO monitoring. |
| Data type | Time series (gauge, delta, cumulative kinds; integer, double, distribution values). |
| Storage and retention | Data kept 24 months (6 weeks for some high-resolution metrics depending on the type). |
| Inputs (internal components) | Google Cloud services (automatic), Ops Agent, OpenTelemetry Collector, Managed Prometheus, log-based metrics. |
| Outputs (internal components) | Alerting policies, dashboards, SLOs. |
| External interactions | Read by Grafana (Google Cloud Monitoring data source), Datadog, Dynatrace, New Relic through the API. |
| Can be opened to the outside | 🟡 Indirectly: through the Cloud Monitoring API and the Prometheus API. |
| Security and access | IAM (Monitoring Viewer, Editor, Metric Writer); multi-project metrics scopes. |
| Cost | Google Cloud metrics free; custom and agent metrics by ingested volume; read API calls. |
Google Cloud Managed Service for Prometheus #
A managed, global Prometheus, stored in Monarch.
| Characteristic | Detail |
|---|---|
| Role | Collect and store Prometheus metrics at scale and query them in PromQL across all projects. |
| Content | Managed collection (PodMonitoring, ClusterPodMonitoring), self-deployed collection (drop-in Prometheus binary), rule evaluator, Prometheus-compatible query frontend. |
| Data type | Prometheus time series. |
| Storage and retention | 24 months, like Cloud Monitoring. |
| Inputs (internal components) | Managed collection on GKE, self-deployed Prometheus, OpenTelemetry Collector (googlemanagedprometheus). |
| Outputs (internal components) | Cloud Monitoring (explorer, PromQL alerts), Prometheus API. |
| External interactions | Grafana and any PromQL tool through the Prometheus HTTP API. |
| Can be opened to the outside | 🟡 Indirectly: through the PromQL API. |
| Security and access | Monitoring IAM; service account for the query frontend. |
| Cost | By number of ingested samples. |
Cloud Logging #
Google Cloud's logging service, organized around the log router.
| Characteristic | Detail |
|---|---|
| Role | Receive, route, store and analyze logs, including audit logs. |
| Content | Log router, sinks, exclusion filters, log buckets, Log Analytics (SQL through BigQuery), log-based metrics, Logging query language. |
| Data type | Structured log entries (LogEntry: resource, severity, text or JSON payload, trace); audit logs (admin activity, data access, system events, policy denied). |
| Storage and retention | _Required bucket: 400 days (admin audit, not modifiable, free); _Default bucket: 30 days; custom buckets from 1 day to 10 years. |
| Inputs (internal components) | Google Cloud services (automatic), Ops Agent, OpenTelemetry Collector, Logging API, GKE. |
| Outputs (internal components) | Buckets, log-based metrics, Error Reporting, log-based alerts. |
| External interactions | Sinks to Pub/Sub, BigQuery, Cloud Storage; read API. |
| Can be opened to the outside | 🟡 Indirectly: through sinks and the API. |
| Security and access | IAM (Logs Viewer, Private Logs Viewer for data access); log views per bucket. |
| Cost | Ingestion beyond the free quota, storage beyond 30 days. |
Cloud Trace #
Google Cloud's distributed tracing service.
| Characteristic | Detail |
|---|---|
| Role | Store spans, analyze request latency and dependencies. |
| Content | Trace Explorer, latency reports, links with logs (trace field of log entries). |
| Data type | Traces and spans (OTLP accepted by the Telemetry API). |
| Storage and retention | Kept 30 days. |
| Inputs (internal components) | OpenTelemetry Collector, OpenTelemetry SDKs, instrumented services (Cloud Run, App Engine). |
| Outputs (internal components) | Console, correlation with Cloud Logging. |
| External interactions | Traces can be duplicated to a third-party APM by the collector. |
| Can be opened to the outside | 🟡 Indirectly: through the Cloud Trace API. |
| Security and access | IAM (Cloud Trace Agent to write, User to read). |
| Cost | By number of spans ingested beyond the free quota. |
Cloud Profiler #
Google Cloud's continuous production profiling.
| Characteristic | Detail |
|---|---|
| Role | Continuously measure where code spends CPU and memory and compare versions. |
| Content | CPU, heap, threads, contention and wall-time profiles depending on the language; flame graphs; comparisons. |
| Data type | Profiles (pprof format). |
| Storage and retention | Profiles kept 30 days. |
| Inputs (internal components) | Profiler agent embedded in the application (Go, Java, Node.js, Python). |
| Outputs (internal components) | Cloud Profiler console. |
| External interactions | No native integration; third-party tools use their own profiling (Pyroscope…). |
| Can be opened to the outside | 🔒 No (internal) |
| Security and access | IAM (Cloud Profiler Agent, User). |
| Cost | No additional charge. |
Error Reporting #
Automatic grouping of application exceptions.
| Characteristic | Detail |
|---|---|
| Role | Detect, group and track errors from logs and notify about new errors. |
| Content | Error groups, occurrences, stack traces, status (open, acknowledged, resolved), notifications. |
| Data type | Exceptions extracted from logs (stack traces). |
| Storage and retention | Depends on the underlying logs. |
| Inputs (internal components) | Cloud Logging. |
| Outputs (internal components) | Notifications to the configured channels. |
| External interactions | None directly. |
| Can be opened to the outside | 🔒 No (internal) |
| Security and access | IAM (Error Reporting Viewer, User). |
| Cost | No additional charge (cost of the logs). |
Alerts and notification channels #
Cloud Monitoring's alerting engine.
| Characteristic | Detail |
|---|---|
| Role | Evaluate conditions on metrics, SLOs or logs and notify. |
| Content | Alerting policies (threshold, metric absence, PromQL, SLO burn rate), log-based alerts, incidents, alert documentation. |
| Data type | Incidents (open, resolved). |
| Inputs (internal components) | Cloud Monitoring, Managed Prometheus, Cloud Logging. |
| Outputs (internal components) | Incidents in the console. |
| External interactions | Email, SMS, mobile app, Slack, PagerDuty, webhooks, Pub/Sub. |
| Can be opened to the outside | 🟠 Yes: outgoing notifications and webhooks. |
| Security and access | Monitoring Editor IAM; webhook tokens. |
| Cost | Per alert condition and per evaluated series. |
Query APIs (Monitoring, Prometheus, Logging, Trace) #
The APIs that expose all Google Cloud observability data for reading.
| Characteristic | Detail |
|---|---|
| Role | Let tools and scripts query metrics, logs and traces. |
| Content | Cloud Monitoring API (timeSeries), Prometheus HTTP API (PromQL), Cloud Logging API (entries.list), Cloud Trace API; client libraries. |
| Data type | JSON or protobuf responses. |
| Inputs (internal components) | Cloud Monitoring, Managed Prometheus, Cloud Logging, Cloud Trace. |
| Outputs (internal components) | Any authorized client. |
| External interactions | Grafana, Datadog, Dynatrace, New Relic, scripts. |
| Can be opened to the outside | 🟠 Yes: googleapis.com endpoints (or Private Service Connect). |
| Security and access | Service account with read roles (Monitoring Viewer, Logs Viewer); VPC Service Controls available. |
| Cost | Monitoring API reads billed beyond the quota. |
Log sinks (Pub/Sub, BigQuery, Cloud Storage) #
The log router outputs, at project, folder or organization level.
| Characteristic | Detail |
|---|---|
| Role | Continuously export filtered logs to an analysis, archiving or streaming destination. |
| Content | Inclusion filter, exclusions, destination, writer identity (service account); aggregated sinks for a whole organization. |
| Data type | Log entries in JSON format. |
| Storage and retention | Depends on the destination: BigQuery (partitioned tables), Cloud Storage (hourly files), Pub/Sub (7 days message retention by default). |
| Inputs (internal components) | Cloud Logging (router). |
| Outputs (internal components) | Buckets in other projects, BigQuery, Cloud Storage, Pub/Sub. |
| External interactions | Splunk (Pub/Sub to Splunk Dataflow template), Datadog, Elastic, Sumo Logic, SIEM through Pub/Sub; BI tools through BigQuery. |
| Can be opened to the outside | 🟠 Yes: it is the main continuous export channel. |
| Security and access | The sink writer identity must be allowed to publish or write to the destination. |
| Cost | Routing is free; destination costs (Pub/Sub, BigQuery, storage). |
4. OpenTelemetry compatibility #
Google collector, Telemetry API and exporters.
Sending OpenTelemetry telemetry to Google Cloud #
Google publishes a Google-Built OpenTelemetry Collector and the googlecloud (traces, metrics, logs) and googlemanagedprometheus exporters from the contrib distribution. The Telemetry API (telemetry.googleapis.com) accepts OTLP directly for traces: a standard collector can use it with Google authentication.
receivers:
  otlp: { protocols: { grpc: {}, http: {} } }
processors:
  batch: {}
  resourcedetection: { detectors: [gcp] }
exporters:
  googlecloud: {}                 # traces et journaux vers Cloud Trace et Cloud Logging
  googlemanagedprometheus: {}     # métriques vers Managed Service for Prometheus
service:
  pipelines:
    traces:  { receivers: [otlp], processors: [resourcedetection, batch], exporters: [googlecloud] }
    metrics: { receivers: [otlp], processors: [resourcedetection, batch], exporters: [googlemanagedprometheus] }
    logs:    { receivers: [otlp], processors: [resourcedetection, batch], exporters: [googlecloud] }
Good practice: Prefergooglemanagedprometheusovergooglecloudfor metrics: they can be queried in PromQL and are billed by number of samples.
5. Interconnections with external products #
Sharing data.
Exporting and integrating #
| Mechanism | Data | Destinations |
|---|---|---|
| Log sink to Pub/Sub | Filtered logs | Splunk (Pub/Sub to Splunk Dataflow template), Datadog, Elastic, Sumo Logic |
| Sink to BigQuery or Cloud Storage | Logs for analysis or archiving | BI tools, data lake, SIEM |
| Service account integrations | Cloud Monitoring metrics | Datadog, Dynatrace, New Relic, Elastic |
| Grafana data source | Cloud Monitoring, Managed Prometheus (PromQL), Logging, Trace | Grafana Cloud or self-hosted |
| Google Security Operations | Security logs | Google's SIEM (Chronicle) |
Good to know: Managed Prometheus exposes a Prometheus-compatible API: Grafana or any PromQL-compatible tool can query it directly.
6. Costs and best practices #
Controlling ingestion.
Best practices #
- Use exclusion filters and suitable retention per log bucket.
- Centralize an organization's logs with aggregated sinks at folder or organization level.
- Define SLOs in Cloud Monitoring and alert on error budget burn rate.
- Enable Cloud Profiler in production: its overhead is low and it reveals performance regressions.
- Instrument with OpenTelemetry and the Google collector to keep portability.
- Watch the cardinality of custom and Prometheus metrics.
Watch out: Data Access audit logs are disabled by default and can be very large: enable them only for the services that need them.
