1. Why share variables across dashboards? #
The problem solved, the two scopes and what changes compared with local variables.
The problem #
Available in : ✓ OSS ✓ Enterprise ✓ Cloud Public preview feature, opt-in
A classic variable only exists in the dashboard where you created it. With thirty dashboards filtered by environment, you recreate the env variable thirty times. Adding a value such as staging means thirty edits, and differences creep in: env here, environment there, prod on one side and production on the other.
Cross-dashboard variables solve this problem: you define the variable once, then several dashboards reuse it. You change it in one place and every dashboard using it follows.
Do not confuse them. The "global" variables seen earlier in this chapter are Grafana's built-in variables, such as$__fromor$__interval. Here, "global" refers to the scope of a variable you create yourself.
Two scopes #
- Global: offered to all dashboards in the organization.
- By folder: offered only to dashboards in the same folder.
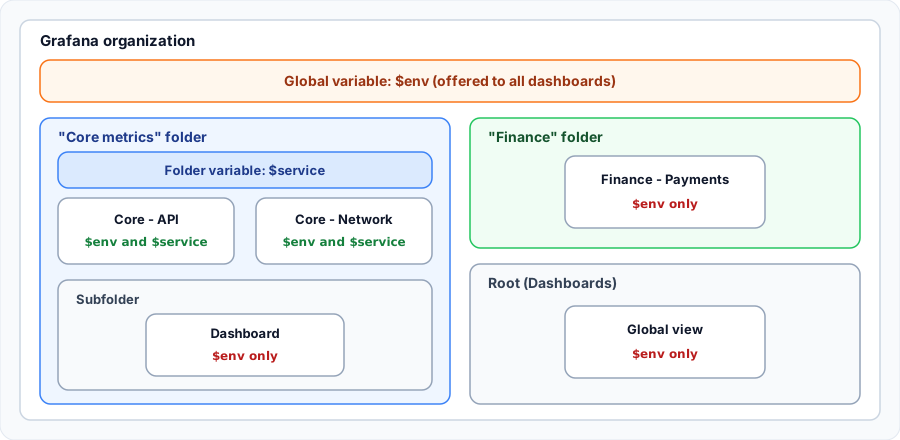
A subfolder does not inherit. In our tests, a dashboard in a subfolder of Core metrics saw no variable from that folder: only global variables were offered.
Local or shared? #
| Local variable | Cross-dashboard variable | |
|---|---|---|
| Where to define it | In the dashboard settings | Dashboards > Variables |
| Where to change it | In each dashboard | In one place |
| Availability | This dashboard only | The whole organization or a folder, once attached |
| Syntax in queries | $env | $env (identical) |
| Status | Stable feature | Public preview (must be enabled) |
Keep a variable local when it only makes sense for one dashboard, such as a display threshold. Share what describes your organization: environment, region, team, customer.
2. Enable the feature #
Feature toggle, Docker, verification and feature status.
A status worth knowing #
Public preview feature. Grafana Labs states limited support and possible breaking changes before general availability. Try it outside production first. The documentation gives no minimum version: this article was verified on Grafana OSS 13.3.0.
The documentation lists it for Grafana Cloud, Enterprise and Open source. On Grafana Cloud, where you cannot access the configuration file, contact Support.
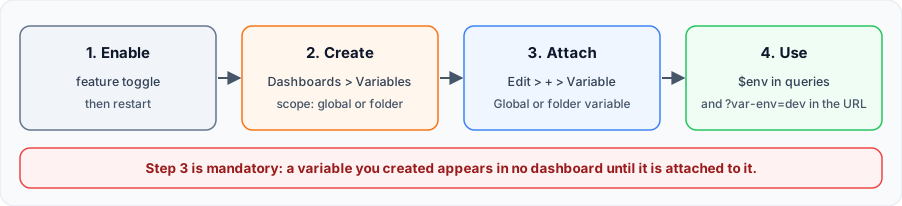
Enable the toggle #
In the configuration file, then restart Grafana:
# /etc/grafana/grafana.ini (or custom.ini)
[feature_toggles]
grafana.dashboardGlobalVariables = true
Or with an environment variable, handy with Docker:
docker run -d --name grafana -p 3000:3000 \
  -e GF_FEATURE_TOGGLES_ENABLE=grafana.dashboardGlobalVariables \
  grafana/grafana:13.3.0
Then check that the toggle is active (admin:admin is the default account of a fresh install: adapt it):
curl -s -u admin:admin http://localhost:3000/api/frontend/settings \
  | jq '.featureToggles["grafana.dashboardGlobalVariables"]'
# true
A Variables entry then appears in the Dashboards menu.
3. Create a shared variable #
The Dashboards > Variables form, field by field.
Step by step #
- Open Dashboards > Variables.
- Click New variable.
- Choose the scope in Folder, then the Variable type.
- Fill in the name, then the options of the chosen type.
- Click Save.

The Folder field trap. The field is called "Folder" even for a global variable: the root Dashboards folder, selected by default, is what makes the variable global. Choose another folder to limit its scope.
The fields #
| Field | Purpose |
|---|---|
| Folder | Scope: Dashboards for a global variable, otherwise the target folder. |
| Variable type | The type of variable (see below). |
| Name | The name used in queries ($env), 50 characters at most. |
| Label | Optional: the name shown in front of the drop-down list. Otherwise Grafana shows the name. |
| Description | Optional: shown through an information icon. Markdown links and URLs are accepted, only http and https are clickable. |
| Display | Above dashboard (default), Above dashboard, label hidden, Controls menu or Hidden. |
Available types #
| Type | Example use |
|---|---|
| Query | Values from the data source: label_values(up, env) |
| Custom | Fixed list: prod,preprod,dev |
| Textbox | Free text, such as an order ID |
| Constant | Hidden value, such as a metric prefix |
| Data source | Switch data source across several panels |
| Interval | Time step: 1m,5m,1h |
| Switch | On or off toggle |
The Grafana 13.3.0 form also offers Filter and Group by, which the documentation page does not mention.
Free values enabled by default. On a Custom variable, Allow custom values is checked by default, so a user can type a value outside the list. Uncheck it if the variable is meant to enforce a naming convention.
The variable list #
The Dashboards > Variables page groups the variables: those of a folder appear under it, global ones at the root of the list.

4. Attach the variable to a dashboard #
The essential step that is often forgotten.
Creating is not enough #
A variable you created does not show up in your dashboards on its own. Until it is attached, the selector is missing and $env is displayed as is, without being replaced:

Step by step #
- Open the dashboard and click Edit.
- Click the + button at the top of the dashboard, then Variable. The Add new element icon in the sidebar does the same.

- Choose Global or folder variable.

- Check the variables you want, or All global and All folder to take all of those in each scope.
- Click Save, optionally add a description, confirm with Save, then click Exit edit.

The panel now displays the selected values:

To remove a variable, go back through the dashboard sidebar. To change it, go through Dashboards > Variables.
Explicit list or "All"? #
| Choice | Observed effect | When to use it |
|---|---|---|
| Variables checked one by one | Only these variables reach the dashboard. | By default: the dashboard stays under control. |
| All global / All folder | A variable added later also appears in the dashboard, without changing it. | When all variables in the scope concern the dashboard. |
Be careful with "All". With All global, any new global variable adds a selector to these dashboards the next time they are opened.
5. Using the variable day to day #
Queries, titles, URLs and central changes.
In queries and titles #
Once attached, the variable works like any other.
# Prometheus: one value
rate(http_requests_total{env="$env", service="$service"}[5m])

# Prometheus: multi-value variable (env=~ and the regex format)
sum by (service) (rate(http_requests_total{env=~"${env:regex}"}[5m]))
With Loki:
{env="$env", service="$service"} |= "error"In a panel title:
${service} errors in ${env}In the URL #
The var- prefix also works: a link preselects the values, which is useful in an alert or a runbook.
https://grafana.example.com/d/core1?var-env=dev&var-service=batchChange it once #
We added a new value and changed the label in Dashboards > Variables: both changes appeared in the dashboard on reload, without editing or saving it.
The trade-off. A mistake spreads everywhere too. Before renaming or deleting a shared variable, find the dashboards using it: renaming breaks the $env in their queries.6. Conflicts, moves and permissions #
What the documentation does not specify, tested on Grafana 13.3.0.
Name conflicts #
The documentation says nothing about conflicts. Here is what we observed. Two variables in the same scope cannot share a name: the form rejects it (A variable with this name already exists in the selected folder) and the API returns 409. A folder variable can, however, have the same name as a global variable.
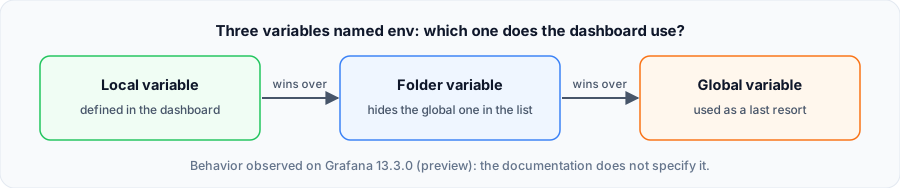
- In that folder, the global
envvariable disappears from the list in favor of the folder one. - If the dashboard also defines a local
envvariable, the local one applies: the shared value is ignored.
Advice. Avoid these duplicates. The same name giving different values depending on the folder makes dashboards hard to understand.
Move or delete #
| Action | Observed result |
|---|---|
| Move a dashboard to another folder | It loses the variables of its former folder: the selector disappears and $service is displayed as is. Global variables remain. |
| Delete a variable in use | The selector disappears the next time the dashboard is opened, with no error message. |
| Delete a folder variable that hid a global one | The dashboard then uses the global variable with the same name, with its values. |
No warning. These cases trigger no alert in Grafana: check your dashboards after moving folders or deleting a variable.
Who can do what? #
| Basic role | Read the list | Create in a folder | Create or change a global one |
|---|---|---|---|
| Viewer | Yes | No (403) | No (403) |
| Editor | Yes | Yes | No (403) |
| Admin | Yes | Yes | Yes |
Results obtained with the API and default organization roles, with no specific folder permission. Check them on your instance if you have customized permissions.
7. Automating with the API #
List and create variables, and read a dashboard's attachments.
Before you start #
Beta API. The documentation page describes neither an API nor provisioning. The calls below are those we validated on Grafana 13.3.0, with version v2beta1: they may change before general availability. Do not build them into critical automation without testing at every upgrade.List #
curl -s -u admin:admin \
  http://localhost:3000/apis/dashboard.grafana.app/v2beta1/namespaces/default/variables \
  | jq -r '.items[] | [.metadata.name, .spec.kind, (.metadata.annotations["grafana.app/folder"] // "global")] | @tsv'
# env                     CustomVariable    global
# region                  ConstantVariable  global
# service--core-metrics   CustomVariable    core-metrics
Create a global variable #
curl -s -u admin:admin -H 'Content-Type: application/json' \
  http://localhost:3000/apis/dashboard.grafana.app/v2beta1/namespaces/default/variables -d '{
  "apiVersion": "dashboard.grafana.app/v2beta1",
  "kind": "Variable",
  "metadata": {"name": "region"},
  "spec": {"kind": "ConstantVariable", "spec": {
    "name": "region",
    "query": "eu-west-3",
    "current": {"text": "eu-west-3", "value": "eu-west-3"},
    "hide": "hideVariable",
    "skipUrlSync": true
  }}
}'
Create a folder variable #
The technical name follows the form <name>--<folder uid>: any other name is rejected with a 400 error. The name to use in queries remains spec.spec.name.
curl -s -u admin:admin -H 'Content-Type: application/json' \
  http://localhost:3000/apis/dashboard.grafana.app/v2beta1/namespaces/default/variables -d '{
  "apiVersion": "dashboard.grafana.app/v2beta1",
  "kind": "Variable",
  "metadata": {
    "name": "service--core-metrics",
    "annotations": {"grafana.app/folder": "core-metrics"},
    "labels": {"grafana.app/folder": "core-metrics"}
  },
  "spec": {"kind": "CustomVariable", "spec": {
    "name": "service",
    "query": "api,front,batch",
    "current": {"text": "api", "value": "api"},
    "options": [],
    "multi": false,
    "includeAll": false,
    "label": "Service",
    "hide": "dontHide",
    "skipUrlSync": false,
    "allowCustomValue": false
  }}
}'
Where is the attachment stored? #
The attachment is not in the dashboard's variables list, which stays empty: it is stored in an annotation. If you version your dashboards, check that your tooling keeps this annotation.
curl -s -u admin:admin \
  http://localhost:3000/apis/dashboard.grafana.app/v2beta1/namespaces/default/dashboards/core1 \
  | jq -r '.metadata.annotations["grafana.app/useCrossDashboardVariables"]'
# {"global":["env"],"folder":["service"]}
The value is "all" with All global or All folder, and "none" if nothing is attached.
8. Best practices and troubleshooting #
Good habits, frequent errors and an exercise.
Best practices #
- Set a naming convention before creating the first variable:
env,region,team. - Keep the global scope for what really concerns the whole organization, and prefer folders for the rest.
- Limit the number of variables attached to a dashboard: too many selectors hurt readability.
- Describe each variable: the Description field helps those who did not create it.
- Test on a non-production instance: the feature may still change.
Troubleshooting #
| Symptom | Likely cause | Fix |
|---|---|---|
| No Variables entry in the menu | Toggle inactive | Enable the toggle, restart and check with /api/frontend/settings. |
$env is displayed as is | Variable not attached | Attach it through Global or folder variable. |
| Variable missing from the attach list | It belongs to another folder, or the dashboard is in a subfolder | Make it global or place the dashboard directly in the right folder. |
| The global variable vanished from the list | A folder variable has the same name | Rename one of them. |
| Shared value ignored | A local variable has the same name | Delete the local variable. |
403 error on creation | Insufficient permissions | A global variable required the Admin role in our tests. |
Your turn #
- Start Grafana with the Docker command from part 2 and check the toggle.
- Create the Core metrics and Finance folders, with a dashboard in each and a Text panel showing
env = $env. - Create the global
envvariable (Custom type, valuesprod,preprod,dev). - Notice that
$envis displayed as is, then attach the variable to both dashboards. - Add the value
stagingin Dashboards > Variables and check that it appears in both dashboards. - In Finance, create an
envvariable with valuesx,yand watch what changes in each folder's attach list.
Sources #
Documentation consulted and behaviors tested in November 2026 on Grafana OSS 13.3.0.
