3. Internal architecture #
Components, services, and the Directed Acyclic Graph (DAG).
The component, the basic building block #
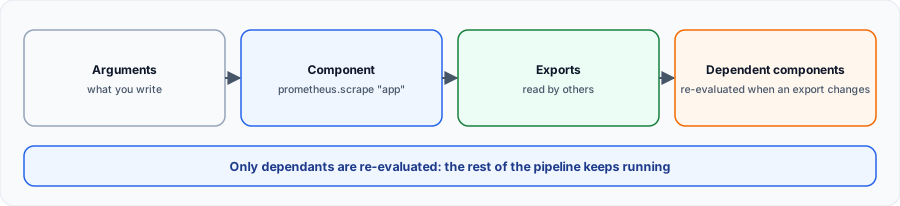
Everything rests on the component. It receives arguments (what you write), runs continuously and publishes exports that other components read. It also has a health state, visible in the UI and through the API.
The graph (DAG) #

At load time, the controller builds a directed acyclic graph (DAG) from the references. It first evaluates components with no dependency, then moves up. After that, when a component publishes a new export, only its dependants are re-evaluated. A newly discovered pod therefore does not disturb log sending.
The graph imposes rules, checked at load time. Here are the real messages from Alloy 1.21:
cycle detected: prometheus.relabel.a, prometheus.relabel.b
block prometheus.remote_write.a already declared at du.alloy:1:1
component "prometheus.remote_write.absent.receiver" does not exist or is out of scope| Error | Cause | Fix |
|---|---|---|
cycle detected | A sends to B, which sends to A | Break the loop: the graph must stay acyclic |
already declared | Two components with the same name and label | Change the label |
does not exist or is out of scope | Reference to a missing component | Check the spelling or the scope of a declare |
Where is the data? #
Some components write to disk, in the --storage.path folder (data-alloy by default). We found there, for example, the prometheus.remote_write WAL and the loki.source.file positions. Make this folder persistent: without it, a restart re-reads files or loses pending metrics.
Reloading without interruption #
A POST /-/reload reloads the configuration. We checked two cases:
- Valid configuration:
config reloadedresponse. - Invalid configuration: 400 response, and running components keep running with the old configuration.
Best practice:alloy runaccepts a folder and loads all its.alloyfiles. Split by domain:10-collecte.alloy,20-envoi.alloy. We tested it: references work from one file to another.
My progress
Sign in to track your progress and take notes. Sign in
💬 Recent discussions about this course
- Alloy : recevoir de l'OTLP et l'envoyer vers Tempo et Mimir✓ solved · 1 reply(ies)
Ask a question about this lesson →See all discussions about this course
Course Glossary
Grafana Alloy
An open-source, vendor-neutral telemetry collector designed to replace Grafana Agent, fully compatible with OpenTelemetry (OTel).
Recommended Articles
Grafana Alloy: Understanding and exploiting the User Interface (UI)
Discover how to enable, secure, and use Grafana Alloy's built-in web interface to visualize your ...
The LGTM stack (Loki, Grafana, Tempo, Mimir): architecture and setup
Grafana Labs' LGTM stack: Loki for logs, Grafana for visualization, Tempo for traces, Mimir for m...
Grafana Alloy vs Grafana Agent vs Promtail: which one to choose?
Discover how telemetry collectors have evolved in the Grafana ecosystem. A detailed comparison of...
Grafana Alloy: collecting and transforming telemetry
Learn how to use Grafana Alloy to collect, transform and route logs, metrics and traces. Discover...
Grafana Alloy vs Dynatrace ActiveGate: Which to choose?
Comparison between Grafana Alloy and Dynatrace ActiveGate. Understand the fundamental differences...
Grafana Alloy vs OpenTelemetry Collector: Which One Should You Choose?
A detailed comparison between Grafana Alloy and the OpenTelemetry Collector. Discover the strengt...
OpenTelemetry Collector, Grafana Alloy and Bindplane: comparing three approaches to telemetry pipelines
Detailed comparison of three ways to manage telemetry pipelines: the OpenTelemetry Collector in Y...
Grafana Alloy components reference
A complete reference guide to all the components available in Grafana Alloy, organized by categor...
Grafana Faro: architecture and installation
Install Grafana Faro: the web SDK (npm or CDN), Alloy's faro.receiver, sending to Loki and Tempo,...