2. The "Programmable Pipelines" concept #
Introduction to declarative syntax.
Why “programmable”? #
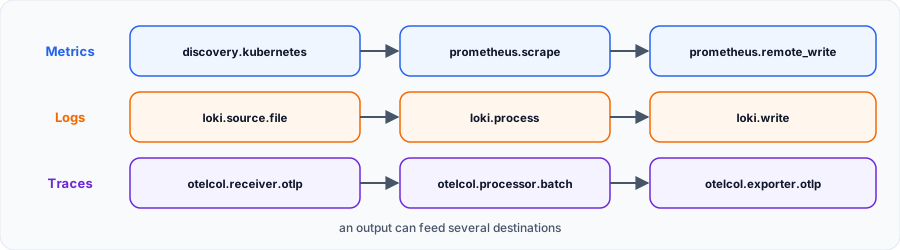
A classic agent is configured with a big YAML file: you describe what to collect, and its internals stay fixed. Alloy reverses this: you assemble components like building blocks and decide the path of your data.
A first pipeline #
Two components are enough. One scrapes, the other sends. The link between them is a simple reference:
prometheus.scrape "app" {
  targets    = [{ "__address__" = "localhost:8080" }]
  forward_to = [prometheus.remote_write.mimir.receiver]
}

prometheus.remote_write "mimir" {
  endpoint {
    url = "http://mimir:9009/api/v1/push"
  }
}
forward_to points to receiver, a value published (exported) by the other component. That is the whole mechanism of the language: an output is plugged into an input. Block order in the file does not matter, because Alloy deduces the execution order from these references.
What assembling allows #
Sending to several destinations. forward_to is a list: the same metrics go to two backends without duplicating collection.
prometheus.relabel "filtre" {
  rule {
    source_labels = ["__name__"]
    regex         = "go_gc_.*"
    action        = "drop"
  }
  forward_to = [
    prometheus.remote_write.mimir.receiver,
    prometheus.remote_write.cloud.receiver,
  ]
}

prometheus.remote_write "mimir" {
  endpoint {
    url = "http://mimir:9009/api/v1/push"
  }
}

prometheus.remote_write "cloud" {
  endpoint {
    url = sys.env("GRAFANA_CLOUD_URL")
  }
}
Deciding on content. Here, debug logs are discarded before sending. In our tests, out of 4 lines read, 3 reached Loki.
loki.process "routage" {
  forward_to = [loki.write.long_terme.receiver]

  stage.json {
    expressions = { level = "" }
  }

  stage.drop {
    source = "level"
    value  = "debug"
  }
}

loki.write "long_terme" {
  endpoint {
    url = "http://loki:3100/loki/api/v1/push"
  }
}
Reusing. The same processing is factored with declare and shared with import.git (see the Variables and Functions lesson).
Static or programmable #
| Classic YAML agent | Alloy | |
|---|---|---|
| Configuration | Predefined sections | Freely assembled components |
| Data path | Set by the tool | Described by your references |
| Target change | Often a global reload | Only affected components are re-evaluated |
| Reuse | Copy and paste | declare, import.* |
Remember: read an Alloy configuration by following the forward_to. You get the real data path, and the UI on port 12345 draws this same graph.My progress
Sign in to track your progress and take notes. Sign in
💬 Recent discussions about this course
- Alloy : recevoir de l'OTLP et l'envoyer vers Tempo et Mimir✓ solved · 1 reply(ies)
Ask a question about this lesson →See all discussions about this course
Course Glossary
Grafana Alloy
An open-source, vendor-neutral telemetry collector designed to replace Grafana Agent, fully compatible with OpenTelemetry (OTel).
Recommended Articles
Grafana Alloy vs Dynatrace ActiveGate: Which to choose?
Comparison between Grafana Alloy and Dynatrace ActiveGate. Understand the fundamental differences...
OpenTelemetry Collector, Grafana Alloy and Bindplane: comparing three approaches to telemetry pipelines
Detailed comparison of three ways to manage telemetry pipelines: the OpenTelemetry Collector in Y...
Grafana Alloy: Understanding and exploiting the User Interface (UI)
Discover how to enable, secure, and use Grafana Alloy's built-in web interface to visualize your ...
Grafana Alloy: Syntax and Configuration (Alloy Language: River)
As part of a Grafana training or observability training, master the declarative syntax of Grafana...
Grafana Alloy vs Grafana Agent vs Promtail: which one to choose?
Discover how telemetry collectors have evolved in the Grafana ecosystem. A detailed comparison of...
Grafana Alloy: collecting and transforming telemetry
Learn how to use Grafana Alloy to collect, transform and route logs, metrics and traces. Discover...
Grafana Alloy vs OpenTelemetry Collector: Which One Should You Choose?
A detailed comparison between Grafana Alloy and the OpenTelemetry Collector. Discover the strengt...
The LGTM stack (Loki, Grafana, Tempo, Mimir): architecture and setup
Grafana Labs' LGTM stack: Loki for logs, Grafana for visualization, Tempo for traces, Mimir for m...
Grafana Alloy: The importance of Self-Monitoring
Discover why and how to configure Grafana Alloy so that it monitors itself, collecting its own lo...