1. Trace Ingestion #
Ingestion via OTLP or third-party protocols (Jaeger, Zipkin).
Receiving traces #
Available in: ✓ OSS ✓ Enterprise ✓ Cloud
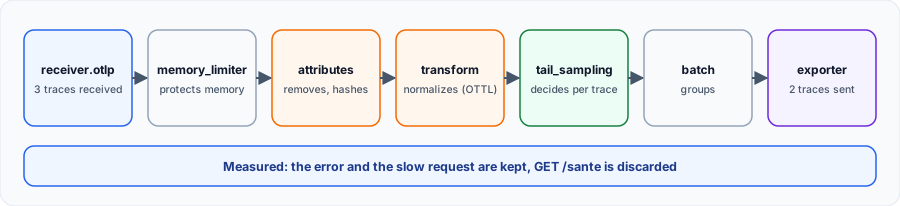
Instrumented applications send their traces to Alloy, which processes them and passes them to Tempo or another backend. Standard OTLP ports are 4317 (gRPC) and 4318 (HTTP).
otelcol.receiver.otlp "default" {
  grpc {
    endpoint = "0.0.0.0:4317"
  }
  http {
    endpoint = "0.0.0.0:4318"
  }
  output {
    traces = [otelcol.processor.memory_limiter.default.input]
  }
}

otelcol.processor.memory_limiter "default" {
  check_interval         = "1s"
  limit_percentage       = 80
  spike_limit_percentage = 20
  output {
    traces = [otelcol.processor.batch.default.input]
  }
}

otelcol.processor.batch "default" {
  output {
    traces = [otelcol.exporter.otlp.tempo.input]
  }
}

otelcol.exporter.otlp "tempo" {
  client {
    endpoint = "tempo:4317"
    tls {
      insecure = true
    }
  }
}
The recommended order #
| Step | Component | Why |
|---|---|---|
| 1 | memory_limiter | First: refuses data before the process runs out of memory |
| 2 | Processing | Attributes, transformations, sampling |
| 3 | batch | Just before sending: groups and reduces the number of requests |
| 4 | otelcol.exporter.otlp | Sending |
Error we hit:limit_percentagealone is refused at startup (“limit_percentage and spike_limit_percentage must be greater than 0”). Set both: that is why the example also setsspike_limit_percentage.
batch setting | Default |
|---|---|
timeout | 200ms |
send_batch_size | 2000 |
send_batch_max_size | 3000 |
Accepting older formats #
During a migration, Alloy also receives Jaeger and Zipkin, then converts everything to the same pipeline. Existing applications have nothing to change.
otelcol.receiver.jaeger "historique" {
  protocols {
    grpc {}
  }
  output {
    traces = [otelcol.processor.batch.default.input]
  }
}

otelcol.receiver.zipkin "historique" {
  output {
    traces = [otelcol.processor.batch.default.input]
  }
}

otelcol.processor.batch "default" {
  output {
    traces = []
  }
}
Checking #
Temporarily plug otelcol.exporter.debug as output: it prints each span in Alloy's logs. This component is experimental: run Alloy with --stability.level=experimental. The otelcol_receiver_accepted_spans_total and otelcol_exporter_sent_spans_total metrics then let you compare input and output.
0.0.0.0:4318makes the receiver reachable from other machines. On a shared host, restrict access or add authentication withotelcol.auth.*.
My progress
Sign in to track your progress and take notes. Sign in
💬 Recent discussions about this course
- Alloy : recevoir de l'OTLP et l'envoyer vers Tempo et Mimir✓ solved · 1 reply(ies)
Ask a question about this lesson →See all discussions about this course
Course Glossary
Grafana Alloy
An open-source, vendor-neutral telemetry collector designed to replace Grafana Agent, fully compatible with OpenTelemetry (OTel).
Recommended Articles
Grafana Alloy: collecting and transforming telemetry
Learn how to use Grafana Alloy to collect, transform and route logs, metrics and traces. Discover...
Grafana Tempo: the distributed tracing backend at scale
Understand distributed tracing and Grafana Tempo: traces, spans, TraceID, architecture (distribut...
The LGTM stack (Loki, Grafana, Tempo, Mimir): architecture and setup
Grafana Labs' LGTM stack: Loki for logs, Grafana for visualization, Tempo for traces, Mimir for m...
Sending traces to Tempo: OpenTelemetry instrumentation and Alloy
Produce and route traces to Tempo: Python/Java/Node auto-instrumentation, the manual SDK, OTEL en...
Grafana Alloy: The importance of Self-Monitoring
Discover why and how to configure Grafana Alloy so that it monitors itself, collecting its own lo...
Grafana Alloy: collecting system metrics and local logs
Learn how to configure Grafana Alloy to monitor the server it runs on, with a focus on configurat...
Beyla and Alloy: zero-code RED metrics and traces with beyla.ebpf
Enable Beyla eBPF instrumentation in Alloy: service discovery, RED metrics to Mimir, traces to Te...
Alloy and the Grafana Labs ecosystem: which component for which tool?
The map of Alloy integrations with Faro, Beyla, k6, Loki, Mimir, Tempo, Pyroscope, Database Obser...
OpenTelemetry traces in depth: spans, status, events, links and sampling
Master the trace signal: anatomy of a distributed trace, span and SpanKind, attributes, status an...