1. Sources #
Listen, collect, observe.
Source families #
| Family | Examples | How it works |
|---|---|---|
| Push | Syslog, Splunk HEC, Splunk TCP, HTTP, OpenTelemetry, Elasticsearch API, TCP JSON | Cribl listens on a port; senders push |
| Pull | Kafka, Amazon SQS et S3, Azure Event Hubs, Google Pub/Sub, Office 365, Okta | Cribl fetches continuously |
| Collectors | S3, REST, Azure Blob, Google Cloud Storage, script | scheduled or on-demand collection (replay) |
| Internal | Datagen, Cribl Internal (logs et métriques), Cribl HTTP / Cribl TCP | generated data, Cribl telemetry, flows from Edge or another Stream |
Breaking into events #
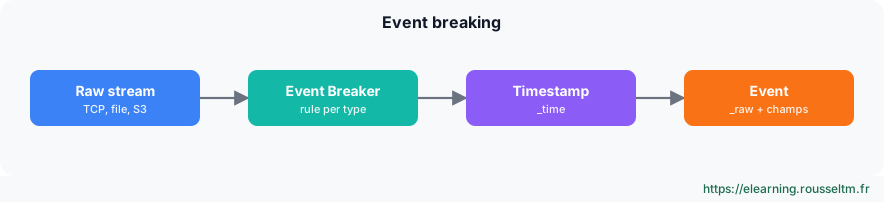
Sources receiving a byte stream (TCP, files, S3 objects) use Event Breakers: rules that split the stream into events (line, JSON, CSV, multi-line header) and extract the timestamp. A wrong rule produces truncated events or a wrong _time: it is the first setting to check.
Best practice : Add fields at the source (Fields), for examplesourcetype,envorteam: routes and pipelines then rely on them.
2. Destinations #
Where data goes.
Overview #
| Type | Examples |
|---|---|
| SIEM | Splunk (HEC, S2S, load-balanced), Microsoft Sentinel, Google SecOps, Elastic Security, QRadar |
| Observability | Datadog, Elasticsearch, Grafana Loki, Prometheus, OpenTelemetry, New Relic, Dynatrace |
| Storage | Amazon S3 and compatible (MinIO), Azure Blob, Google Cloud Storage, Cribl Lake, filesystem |
| Streaming | Kafka, Amazon Kinesis, Azure Event Hubs, Google Pub/Sub |
| Special | Output Router (picks a destination by filter), Default, DevNull (discards), Cribl HTTP / TCP, Cribl Search |
Each destination defines a format (JSON, raw, Parquet…), compression, TLS, and a backpressure behaviour: block, drop or persistent queue (see the production chapter).
3. Routes #
Who goes where, with which processing.
The routing table #
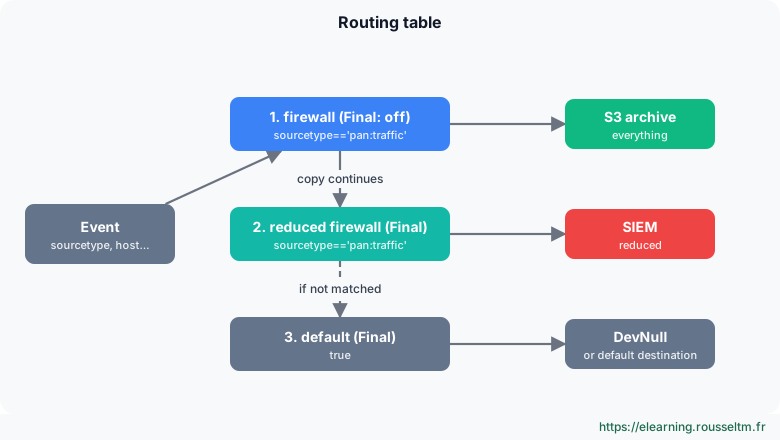
- Routes are evaluated in order, top to bottom. Each route has a filter (JavaScript expression), a pipeline and a destination.
- With Final enabled (the default), an event matched by the route stops there. With Final disabled, a copy is processed and the event continues to the following routes: that is how you send the same data to several destinations.
- The last route,
true, catches the rest: send it to a default destination or to DevNull, deliberately.
Useful filters #
| Filter | Matches |
|---|---|
sourcetype=='pan:traffic' | Palo Alto traffic logs |
__inputId.startsWith('syslog:') | everything arriving through a syslog source |
host.endsWith('.prod.local') && level=='error' | errors from production hosts |
/failed password/i.test(_raw) | SSH authentication failures |
C.Net.cidrMatch('10.0.0.0/8', src_ip) | internal addresses |
QuickConnect #
QuickConnect graphically links a source to a destination, with a pipeline or Pack in between, without the routing table. Handy for simple, independent flows; as soon as you need cloning, priorities or fine filtering, prefer routes.
4. Seeing the data #
Capture before transforming.
Capture and samples #
- Live Data (on a source, route or destination) shows passing events in real time.
- Capture records a few seconds or a few hundred events, at a precise point in the journey (before or after pipelines).
- Save the capture as a sample file: it will be used to build and test pipelines in the preview.
Watch out : Samples contain real data: mask them or limit sharing if they contain personal data.
Commands to know #
Commands to know
logger -n 127.0.0.1 -P 9514 -T 'test cribl': send a test syslog messagecurl -s http://localhost:8088/services/collector/event -H "Authorization: Splunk <jeton>" -d '{"event":"test"}': send an HEC event__inputId.startsWith('syslog:'): filter by sourceC.Net.cidrMatch('10.0.0.0/8', src_ip): filter by network
Sources #
Checked in November 2026 (Cribl 4.20): Cribl ships a minor release about every two months, check the release notes before relying on a detail.
My progress
Sign in to track your progress and take notes. Sign in
💬 Questions about this lesson
No questions yet: be the first to ask for help or share your configuration.
Recommended Articles
Cribl: the data pipeline for observability and security
Discover Cribl: why a telemetry data pipeline, the Cribl suite (Stream, Edge, Lake, Search, Cribl...
Cribl Stream and Edge best practices
Best practices for running Cribl in production: route and pipeline design, naming, performance, c...
Cribl Edge: collecting close to the sources
Deploying Cribl Edge on Linux, Windows and Kubernetes: the agent's role, Fleets and Subfleets, co...
Bindplane configurations: sources, processors, destinations and versions
Build Bindplane configurations: sources, processors and destinations, the pipeline editor, snapsh...
Vector: sources in detail
Vector sources: files, Kubernetes logs, journald, syslog, sockets, HTTP, OpenTelemetry, Kafka, th...
Other log sources and queues: syslog, Fluent Bit, Kafka, Redis
Written version of the video lessons: collect syslog, Fluent Bit and other sources, then insert a...
Cribl Stream in production: distributed architecture, persistent queues and monitoring
Taking Cribl Stream to production: Leader, Worker Groups and processes, commit and deploy, scalin...
Installing and administering Cribl Stream
Installing Cribl Stream with Docker or on Linux, running it as a service, understanding $CRIBL_HO...
Reducing, masking and routing telemetry with Bindplane
Reduce ingestion costs with Bindplane: severity filters, deduplication, sampling, field removal, ...