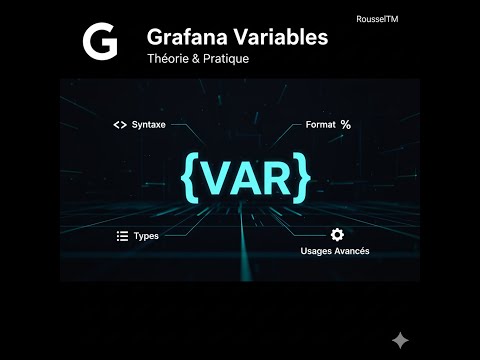
Découvrez le pouvoir des variables dans Grafana et transformez vos tableaux de bord statiques en outils dynamiques et interactifs ! 🚀
Cette vidéo est une ressource essentielle pour quiconque souhaite pousser plus loin son utilisation de Grafana. Nous allons plonger profondément dans la théorie qui sous-tend les variables, comprendre leur syntaxe, explorer les différents formats disponibles et voir comment les appliquer concrètement pour résoudre des défis réels d'observabilité.
Au programme de cette formation complète :
Comprendre la Notion de Variable : Qu'est-ce qu'une variable Grafana ? Pourquoi sont-elles indispensables pour l'efficacité et la réutilisabilité de vos dashboards ? Nous démystifierons leur rôle central dans la création d'expériences utilisateur flexibles.
Les Types de Variables Fondamentaux : Découvrez les types de variables les plus courants (Query, Custom, Textbox, Interval, Datasource, Ad-hoc filters) et quand utiliser chacun d'eux.
Syntaxe des Variables : Maîtrisez la syntaxe correcte pour intégrer vos variables dans les requêtes (ex: ${variable_name} ou $variable_name) et d'autres éléments de vos dashboards.
Formats de Variables Avancés : Allez au-delà de la simple substitution ! Nous explorerons les formats comme raw, json, csv, singlequote, doublequote, percentencode, regex et glob, qui sont cruciaux pour construire des requêtes complexes et robustes.
Cas Pratiques et Démonstrations :
Filtrage Dynamique : Utilisez les variables pour filtrer des données par serveur, application, environnement ou région.
Changement de Source de Données : Permettez aux utilisateurs de basculer entre différentes sources de données (Prometheus, Loki, etc.) à la volée.
Intervalles de Temps Flexibles : Créez des options d'intervalle de temps personnalisées pour des analyses précises.
Variables Dépendantes (Chaînées) : Construisez des menus déroulants qui se filtrent les uns les autres pour une navigation intuitive.
Bonnes Pratiques : Apprenez à optimiser l'utilisation de vos variables pour la performance et la maintenabilité de vos tableaux de bord.
Que vous soyez un administrateur Grafana, un ingénieur DevOps, un SRE ou un analyste de données, cette vidéo vous donnera les clés pour transformer vos dashboards en de véritables outils d'exploration de données sur mesure.
👉 Pour approfondir vos compétences en observabilité et découvrir plus de formations techniques, nous vous invitons à visiter le site web de notre partenaire : https://elearning.rousseltm.fr
N'oubliez pas de liker, commenter et vous abonner pour ne rater aucune de nos prochaines vidéos !
#Grafana #Variables #Observabilité #Dashboard #DataVisualization #Monitoring #IT #DevOps #SRE #Tutoriel #FormationIT #TableauDeBord #Dataviz #PerformanceIT #GrafanaTips #GrafanaTricks #InfrastructureAsCode
Course Glossary
Alerting
The process of notifying teams (via email, Slack, Teams) when a specific event, threshold breach, or anomaly is detected.
HTTP Code 200 (OK)
An HTTP status code indicating that the client's request was successfully processed by the server.
HTTP Code 403 (Forbidden)
An HTTP status code indicating that the server understood the request but refuses to authorize it, usually due to a lack of permissions.
HTTP Code 404 (Not Found)
An HTTP status code indicating that the requested resource could not be found on the server.
Grafana
An open-source interactive data visualization platform that allows users to create, explore, and share analytic dashboards from multiple time-series d...
Recommended Articles
License consumption types
Understand the evolution of billing in Dynatrace: the difference between the old licensing model ...
Grafana Alloy: The importance of Self-Monitoring
Discover why and how to configure Grafana Alloy so that it monitors itself, collecting its own lo...
Grafana Alloy: Understanding and exploiting the User Interface (UI)
Discover how to enable, secure, and use Grafana Alloy's built-in web interface to visualize your ...
Grafana Alloy: Introduction and Architecture
Discover the fundamental concepts of Grafana Alloy, the transition from the static Agent to Alloy...
Grafana Alloy: Syntax and Configuration (Alloy Language: River)
As part of a Grafana training or observability training, master the declarative syntax of Grafana...
Grafana Alloy: Metrics Collection (Prometheus & Ecosystem)
Learn how to configure Grafana Alloy to collect, transform, and forward metrics using the Prometh...
Grafana Alloy: Log Management with Loki
Discover how to configure Grafana Alloy to read log files, journald, or network streams, process ...
Grafana Alloy: Trace Management with Tempo
Dive into distributed trace processing. Learn how to ingest OTLP, Jaeger, or Zipkin traces with G...
Grafana Alloy: Continuous Profiling with Pyroscope
Discover how to configure continuous profiling in your environments using Grafana Alloy and Pyros...
Grafana Alloy: Advanced Deployment and Clustering
Learn how to manage large-scale Grafana Alloy deployments. Configure Clustering mode for high ava...
Grafana Assistant: AI at the service of observability
Discover Grafana Assistant, the artificial intelligence integrated into Grafana Cloud. Learn how ...
Grafana Alloy vs OpenTelemetry Collector: Which One Should You Choose?
A detailed comparison between Grafana Alloy and the OpenTelemetry Collector. Discover the strengt...
Grafana Alloy vs Dynatrace ActiveGate: Which to choose?
Comparison between Grafana Alloy and Dynatrace ActiveGate. Understand the fundamental differences...