1. Receiving endpoints #
Four ways to send your data.
Overview #
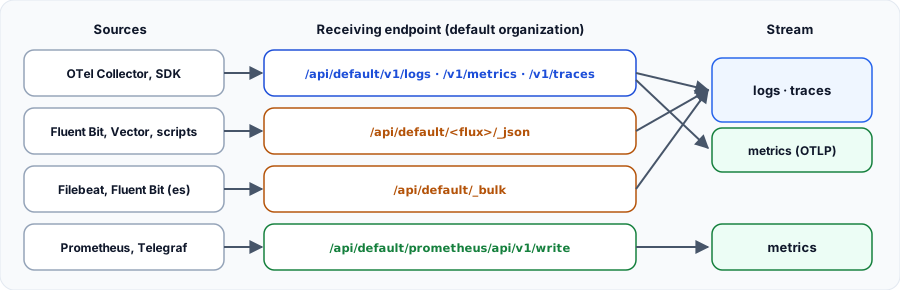
| Format | Path | Check |
|---|---|---|
| JSON | /api/default/<stream>/_json | Tested |
| Bulk, Elasticsearch compatible | /api/default/_bulk | Tested |
| OTLP HTTP | /api/default/v1/logs, /v1/metrics, /v1/traces | Tested |
| Prometheus remote write | /api/default/prometheus/api/v1/write | Documented |
2. OpenTelemetry #
The recommended path for applications.
The Collector to OpenObserve #
The otlphttp exporter appends /v1/logs, /v1/metrics and /v1/traces itself: just set the base /api/default. The stream-name header selects the stream for logs and traces.
receivers:
  otlp:
    protocols:
      grpc:
        endpoint: 0.0.0.0:4317
      http:
        endpoint: 0.0.0.0:4318

processors:
  batch:

exporters:
  otlphttp/openobserve:
    endpoint: http://openobserve:5080/api/default
    headers:
      Authorization: "Basic ${env:O2_AUTH}"
      stream-name: applis

service:
  pipelines:
    logs:
      receivers: [otlp]
      processors: [batch]
      exporters: [otlphttp/openobserve]
    metrics:
      receivers: [otlp]
      processors: [batch]
      exporters: [otlphttp/openobserve]
    traces:
      receivers: [otlp]
      processors: [batch]
      exporters: [otlphttp/openobserve]
export O2_AUTH=$(printf 'root@example.com:Complexpass#123' | base64)Where does data land? #
| Signal | Observed result |
|---|---|
| Logs | Stream named by stream-name, with body, severity and service_name |
| Traces | Stream of type traces (default by default) |
| Metrics | One stream of type metrics per metric, queryable with PromQL |
3. Prometheus and Fluent Bit #
Reusing existing collectors.
Prometheus remote write #
remote_write:
  - url: http://openobserve:5080/api/default/prometheus/api/v1/write
    basic_auth:
      username: root@example.com
      password: Complexpass#123
Fluent Bit #
The http output targets the _json endpoint. Json_date_key _timestamp keeps the original timestamp.
[OUTPUT]
  Name http
  Match *
  URI  /api/default/applis/_json
  Host openobserve
  Port 5080
  tls  Off
  Format json
  Json_date_key    _timestamp
  Json_date_format iso8601
  HTTP_User root@example.com
  HTTP_Passwd Complexpass#123
Filebeat or any bulk client #
The _bulk endpoint follows the Elasticsearch format: migrating an existing collector is often a simple address change. The index name becomes the stream name.
cat > lot.ndjson <<'EOF'
{"index":{"_index":"applis"}}
{"level":"warn","message":"file presque pleine"}
EOF
curl -u 'root@example.com:Complexpass#123' \
  -H 'Content-Type: application/x-ndjson' \
  --data-binary @lot.ndjson http://localhost:5080/api/default/_bulk
4. Authentication #
Do not send everything with the root account.
Using an ingestion token #
Each user has an ingestion token, visible in the UI under Data Sources or through the API. Create an account dedicated to collection rather than using the root password.
curl -s -u 'root@example.com:Complexpass#123' http://localhost:5080/api/default/passcodeMy progress
Sign in to track your progress and take notes. Sign in
Recommended Articles
Exploring data in OpenObserve: SQL, PromQL and VRL
Search with SQL, query metrics with PromQL, optimize a stream (indexes, partitions, retention) an...
Installing OpenObserve and ingesting your first data
Install OpenObserve with Docker Compose or the binary, configure it with its ZO_* variables, send...
OpenObserve: architecture and concepts
Understanding OpenObserve: Parquet storage, deployment modes, roles (router, ingester, querier, c...
Alerts and pipelines in OpenObserve
Create a template, a destination and an alert, avoid the SSRF webhook block and process data with...
OpenObserve in production: best practices
Choose your deployment mode, organize streams, secure, back up and monitor OpenObserve in product...
Ingérer des métriques dans VictoriaMetrics : scraping, vmagent et remote write
Toutes les façons d'alimenter VictoriaMetrics : remote write depuis Prometheus, scraping intégré,...
Grafana Alloy: Metrics Collection (Prometheus & Ecosystem)
Learn how to configure Grafana Alloy to collect, transform, and forward metrics using the Prometh...
OpenTelemetry Collector : les Exporters (envoyer la télémétrie vers les backends)
Configurer les exporters du Collector OpenTelemetry : OTLP gRPC/HTTP, Prometheus, prometheusremot...
Les Data Sources dans Grafana : Connectez et unifiez vos données
Apprenez à étendre les capacités de Grafana via les Data Sources. Découvrez les plugins essentiel...