1. Receiving endpoints #
Four ways to send your data.
Overview #
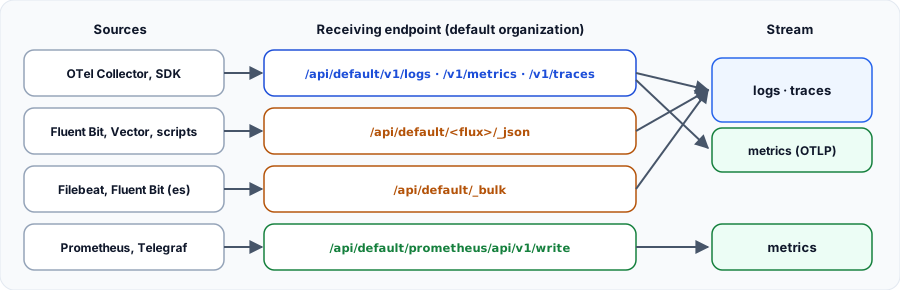
| Format | Path | Check |
|---|---|---|
| JSON | /api/default/<stream>/_json | Tested |
| Bulk, Elasticsearch compatible | /api/default/_bulk | Tested |
| OTLP HTTP | /api/default/v1/logs, /v1/metrics, /v1/traces | Tested |
| Prometheus remote write | /api/default/prometheus/api/v1/write | Documented |
2. OpenTelemetry #
The recommended path for applications.
The Collector to OpenObserve #
The otlphttp exporter appends /v1/logs, /v1/metrics and /v1/traces itself: just set the base /api/default. The stream-name header selects the stream for logs and traces.
receivers:
  otlp:
    protocols:
      grpc:
        endpoint: 0.0.0.0:4317
      http:
        endpoint: 0.0.0.0:4318

processors:
  batch:

exporters:
  otlphttp/openobserve:
    endpoint: http://openobserve:5080/api/default
    headers:
      Authorization: "Basic ${env:O2_AUTH}"
      stream-name: applis

service:
  pipelines:
    logs:
      receivers: [otlp]
      processors: [batch]
      exporters: [otlphttp/openobserve]
    metrics:
      receivers: [otlp]
      processors: [batch]
      exporters: [otlphttp/openobserve]
    traces:
      receivers: [otlp]
      processors: [batch]
      exporters: [otlphttp/openobserve]
export O2_AUTH=$(printf 'root@example.com:Complexpass#123' | base64)Where does data land? #
| Signal | Observed result |
|---|---|
| Logs | Stream named by stream-name, with body, severity and service_name |
| Traces | Stream of type traces (default by default) |
| Metrics | One stream of type metrics per metric, queryable with PromQL |
3. Prometheus and Fluent Bit #
Reusing existing collectors.
Prometheus remote write #
remote_write:
  - url: http://openobserve:5080/api/default/prometheus/api/v1/write
    basic_auth:
      username: root@example.com
      password: Complexpass#123
Fluent Bit #
The http output targets the _json endpoint. Json_date_key _timestamp keeps the original timestamp.
[OUTPUT]
  Name http
  Match *
  URI  /api/default/applis/_json
  Host openobserve
  Port 5080
  tls  Off
  Format json
  Json_date_key    _timestamp
  Json_date_format iso8601
  HTTP_User root@example.com
  HTTP_Passwd Complexpass#123
Filebeat or any bulk client #
The _bulk endpoint follows the Elasticsearch format: migrating an existing collector is often a simple address change. The index name becomes the stream name.
cat > lot.ndjson <<'EOF'
{"index":{"_index":"applis"}}
{"level":"warn","message":"file presque pleine"}
EOF
curl -u 'root@example.com:Complexpass#123' \
  -H 'Content-Type: application/x-ndjson' \
  --data-binary @lot.ndjson http://localhost:5080/api/default/_bulk
4. Authentication #
Do not send everything with the root account.
Using an ingestion token #
Each user has an ingestion token, visible in the UI under Data Sources or through the API. Create an account dedicated to collection rather than using the root password.
curl -s -u 'root@example.com:Complexpass#123' http://localhost:5080/api/default/passcodeMy progress
Sign in to track your progress and take notes. Sign in
Recommended Articles
Collecteurs de logs légers : Fluent Bit, Vector et les autres
Pourquoi un collecteur de logs, ce qui distingue les agents légers (Fluent Bit, Vector) des colle...
Corréler traces, métriques, logs et profils avec OpenTelemetry
Relier les quatre signaux pour diagnostiquer vite : ressource commune, trace_id dans les logs, ex...
Grafana Alloy vs OpenTelemetry Collector: Which One Should You Choose?
A detailed comparison between Grafana Alloy and the OpenTelemetry Collector. Discover the strengt...
OpenTelemetry et Dynatrace : OTLP, collecteur et instrumentation
Intégrer OpenTelemetry à Dynatrace : endpoint OTLP et jetons, Dynatrace OTel Collector, traces, m...
Bonnes Pratiques OpenTelemetry (OTel) : Le Guide de l'Observabilité Moderne
Maîtrisez OpenTelemetry grâce à nos conseils d'experts : implémentation du Collector, respect des...
Grafana Alloy: Trace Management with Tempo
Dive into distributed trace processing. Learn how to ingest OTLP, Jaeger, or Zipkin traces with G...
Grafana Alloy: The importance of Self-Monitoring
Discover why and how to configure Grafana Alloy so that it monitors itself, collecting its own lo...
Data streams et templates Elasticsearch : component templates, index templates et séries temporelles
Gérer les données horodatées avec les data streams : index templates et component templates, conv...
APM Datadog et OpenTelemetry : traces, services et corrélation avec les logs
Instrumenter ses applications pour l'APM Datadog (dd-trace, instrumentation en une étape, OpenTel...