1. Why recording rules? #
Compute in advance rather than on every read.
The problem #
A PromQL query is computed when it runs. On a twenty-panel dashboard, refreshed every thirty seconds and opened by ten people, Prometheus keeps repeating the same computations on the same samples. The dashboard gets slow, and every extra user makes it worse.
A recording rule solves this: Prometheus evaluates the expression at a regular interval and writes the result to a new series. Reads become simple accesses to that series.
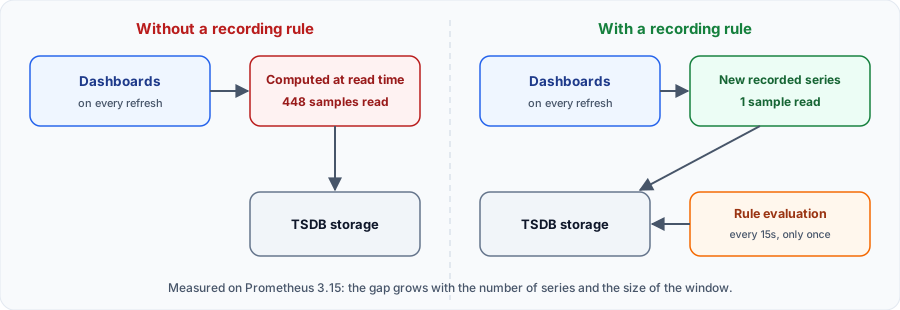
Real measurement: on a test Prometheus 3.15, withstats=all,sum by (job) (rate(prometheus_http_requests_total[5m]))reads 448 samples, and the equivalent recorded series just one. The gap is far larger on a production server.
When to use them, and when not to #
| Good idea | Bad idea |
|---|---|
| Expensive, frequent query (heavily used dashboard) | Query run rarely, by hand |
| Alert with a heavy expression | Query already fast on few series |
| Shared indicator (SLI, error rate) defined only once | Keeping all original labels: nothing is reduced |
| Aggregates to keep for a long time or to federate | Replacing exploration: the window (5m) is fixed |
A rule is not free: each recorded series uses storage and memory, like a scraped series. The gain comes from aggregation: replacing thousands of series with a few dozen.
2. How Prometheus evaluates them #
Groups, interval, order and no retroactive effect.
How it works #
- Rules live in groups, declared in files referenced by
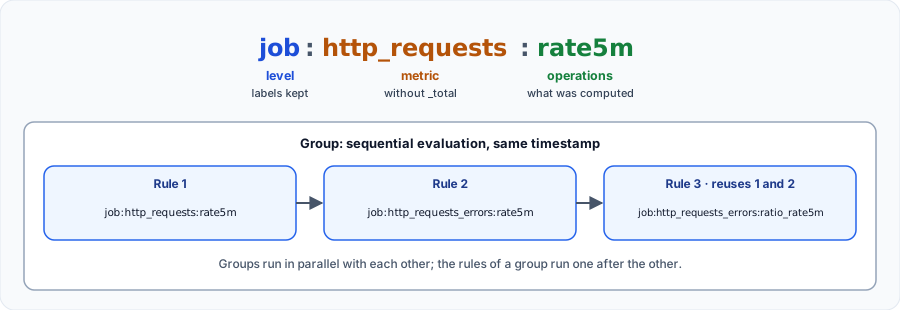
rule_files. - Within a group they run in order, at the same timestamp. A rule can therefore use the result of the previous one.
- The interval is the group's (
interval), otherwise the globalevaluation_interval. - The result keeps the labels of the expression; the metric name is replaced by
record. - A rule only computes the present: a new rule has no history, unless recomputed manually (see below).
Mind the interval: a series with no point for more than five minutes (the default lookback) no longer appears in instant queries. A group evaluated every ten minutes therefore produces gaps.
My progress
Sign in to track your progress and take notes. Sign in
Course Glossary
Alerting
The process of notifying teams (via email, Slack, Teams) when a specific event, threshold breach, or anomaly is detected.
Architecture
The overall structural design of an IT system, defining its various components, their relationships, and the principles guiding its evolution.
OpenTelemetry
An open source framework providing standards, APIs, and SDKs to collect and export observability data (traces, metrics, logs) in an agnostic way.
Recommended Articles
Bonnes pratiques Prometheus : métriques, cardinalité, règles et exploitation
Bonnes pratiques Prometheus : nommage des métriques, labels et cardinalité, intervalles de scrape...
Thanos Ruler : règles et alertes sur la vue globale
Évaluer des règles d'enregistrement et d'alerte sur l'ensemble des clusters avec Thanos Ruler : c...
Mesurer des SLI avec Prometheus
Implémenter des SLI de disponibilité et de latence avec Prometheus : métriques nécessaires, requê...
Mimir : ruler, Alertmanager et mimirtool
Évaluer des règles d'enregistrement et d'alerte dans Mimir, configurer l'Alertmanager multi-tenan...
Écrire de bonnes règles d'alerte Prometheus (et les tester)
Concevoir des alertes utiles : alerter sur les symptômes, choisir for et les seuils, labels de sé...
Prometheus : visualiser ses métriques (UI, Grafana et dashboards)
Visualiser les données Prometheus : interface web, graphes PromQL, connexion à Grafana, dashboard...
Générer ses SLO Prometheus avec Sloth
Décrire un SLO en quelques lignes avec Sloth et générer automatiquement règles d'enregistrement m...
Alerter sur les logs avec le Ruler de Loki
Mettre en place des alertes et des recording rules LogQL avec le Ruler Loki : configuration, fich...
Grafana Alloy: Understanding and exploiting the User Interface (UI)
Discover how to enable, secure, and use Grafana Alloy's built-in web interface to visualize your ...