1. What is chaos engineering? #
Definition, origin and goals.
Definition #
Chaos engineering is the discipline of experimenting on a system to build confidence in its ability to withstand turbulent conditions in production. It is not about « breaking things at random », but about running controlled experiments, driven by a hypothesis, to discover weaknesses before they cause an incident.
The practice was born at Netflix around 2010 with Chaos Monkey, which randomly terminated instances in production to force teams to design fault-tolerant services. The principles were formalized on principlesofchaos.org.
Why do it? #
- Check that resilience mechanisms (redundancy, failover, retries, timeouts, circuit breakers) really work.
- Discover hidden dependencies and unexpected failure modes.
- Reduce time to detect and recover by training teams.
- Validate alerts, dashboards and procedures (runbooks).
- Build a culture where failure is expected and studied.
Good to know: A failover that has never been tested often fails on the day you need it. Chaos engineering turns hope into evidence.
2. The principles of an experiment #
Steady state, hypothesis, blast radius.
The five principles #
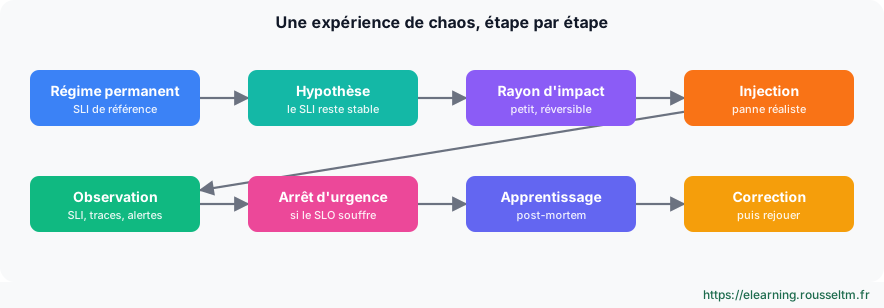
- Define the steady state: a measure of normal behavior visible to users, in practice an SLI (success rate, p99 latency, orders per minute).
- Form a hypothesis: « the steady state holds in the experimental group as in the control group ».
- Introduce real-world events: server failures, network latency, saturation, dependency errors.
- Experiment in production when possible, because real traffic and environments reveal what tests do not show.
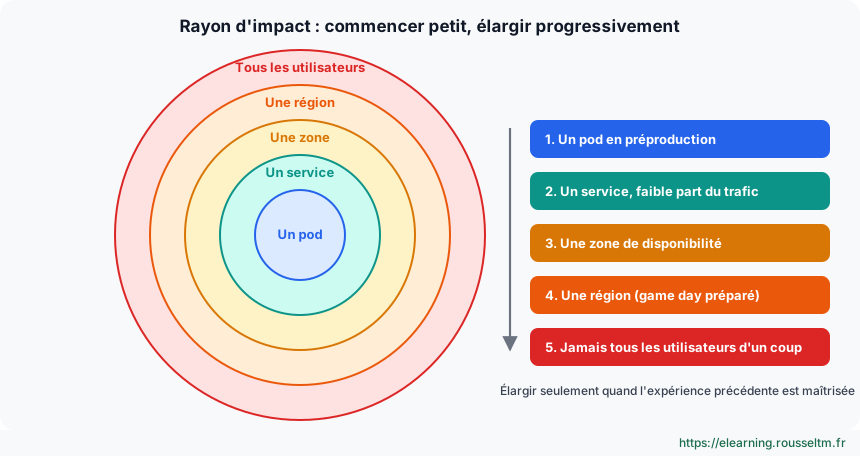
- Automate and run continuously, while minimizing the blast radius.
Controlling the blast radius #
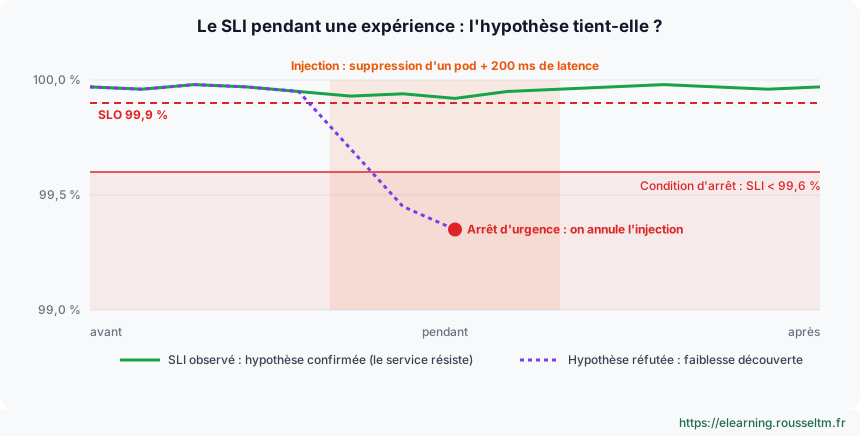
Start small: one pod, one instance, a small percentage of traffic, in pre-production and then in production. Define in advance the stop conditions (the SLI drops below a threshold, a critical alert fires) and a way to immediately cancel the injection.
Common mistake: Running an experiment without observability or stop conditions is causing an incident, not running an experiment.
3. Chaos engineering and SRE #
SLOs, error budgets and learning.
Relying on SLOs #
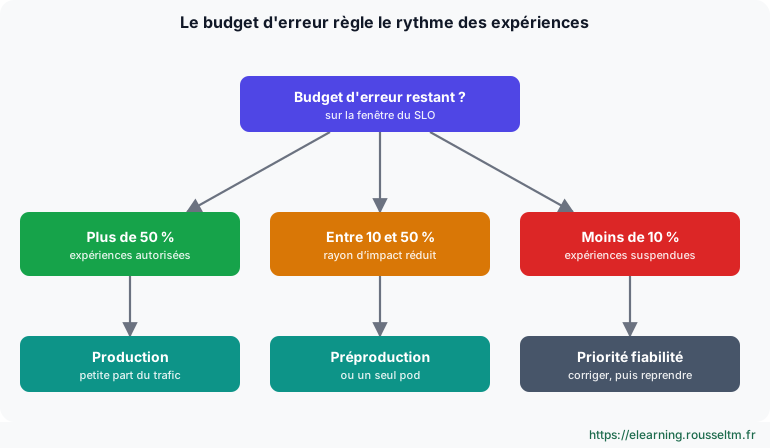
SRE provides the ideal framework: SLIs define the steady state, SLOs set the stop threshold and the error budget tells how much unavailability the team can afford. Some teams explicitly reserve part of the budget for experiments: as long as budget remains, they experiment; once it is exhausted, risky experiments are frozen like releases.
| SRE concept | Role in chaos engineering |
|---|---|
| SLI | Measure of the steady state during the experiment |
| SLO | Limit beyond which the experiment is stopped |
| Error budget | Allows or suspends experiments depending on consumption |
| Burn rate alerts | Must fire if the injection really degrades the service |
| Blameless post-mortem | Format for sharing what the experiment taught |
What you learn #
A successful experiment is not one that breaks nothing: it is one that teaches you something. If the hypothesis is refuted, document the weakness, prioritize the fix, then replay the experiment to verify.
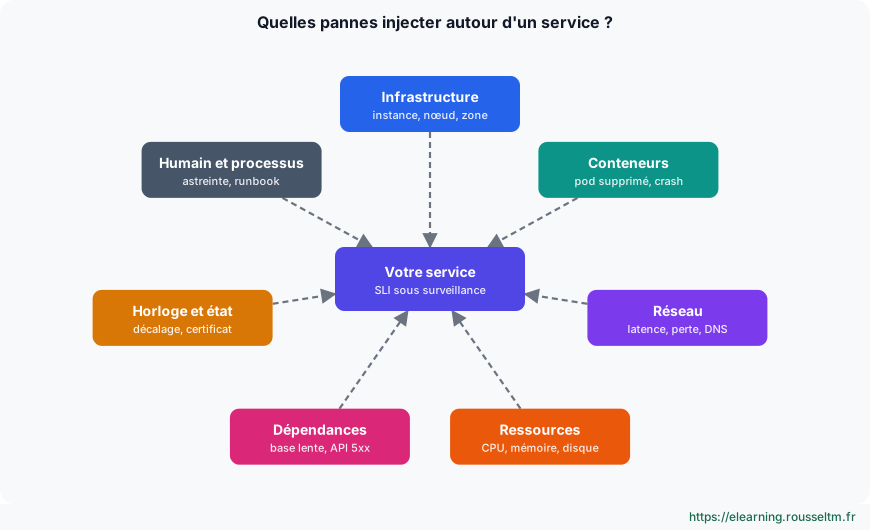
4. Which failures to inject? #
Catalog of realistic failures.
Failure types #
| Category | Examples | What you check |
|---|---|---|
| Infrastructure | Loss of an instance, a node, a zone | Redundancy, self-healing, failover |
| Containers | Pod deletion, crash loops | Replicas, probes, PodDisruptionBudget |
| Network | Latency, packet loss, partition, failing DNS | Timeouts, retries, circuit breakers |
| Resources | CPU, memory, disk saturation | Limits, autoscaling, graceful degradation |
| Dependencies | Slow database, third-party API returning 5xx | Cache, degraded mode, queues |
| Clock and state | Clock skew, expired certificate | Robustness of validity checks |
| People and process | Key person absent, missing procedure | Documentation, on-call, runbooks |
5. The tools #
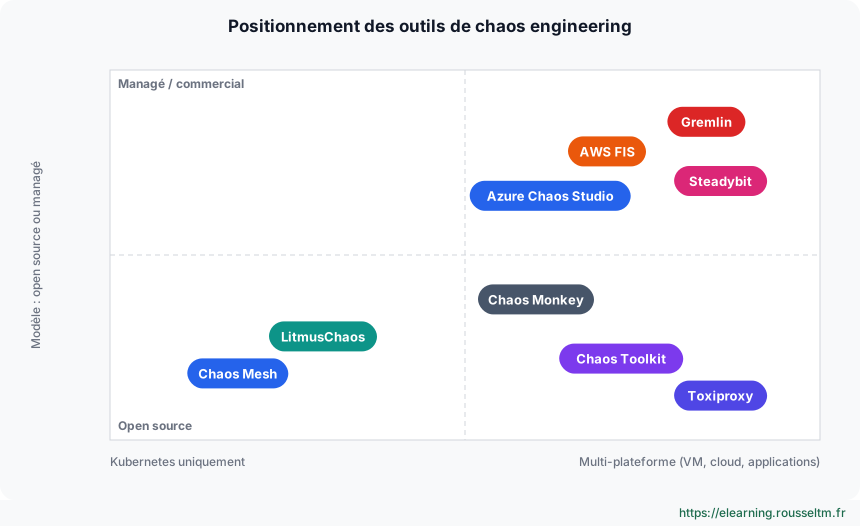
Comparison of the main tools.
Overview #
| Tool | Type | Strengths |
|---|---|---|
| Chaos Mesh | Open source (CNCF), Kubernetes | PodChaos, NetworkChaos, StressChaos, IOChaos resources; dashboard; workflows |
| LitmusChaos | Open source (CNCF), Kubernetes | ChaosHub of ready-to-use experiments, validation probes |
| Chaos Toolkit | Open source, multi-platform | Declarative experiments in JSON/YAML, cloud and Kubernetes extensions |
| AWS Fault Injection Service | AWS managed service | Experiment templates on EC2, ECS, EKS, RDS; CloudWatch stop conditions |
| Azure Chaos Studio | Azure managed service | VM, AKS, network faults; scheduled experiments |
| Gremlin, Steadybit | Commercial platforms | Scenario library, guardrails, reports |
| Toxiproxy | Test proxy | Latency and cuts between an application and its dependencies, ideal in integration tests |
| Chaos Monkey | Netflix (Spinnaker) | Random instance termination, the origin of the discipline |
6. Hands-on on Kubernetes #
Chaos Mesh and Chaos Toolkit step by step.
Installing Chaos Mesh #
helm repo add chaos-mesh https://charts.chaos-mesh.org
helm install chaos-mesh chaos-mesh/chaos-mesh -n chaos-mesh --create-namespace \
  --set chaosDaemon.runtime=containerd --set chaosDaemon.socketPath=/run/containerd/containerd.sock
kubectl get pods -n chaos-mesh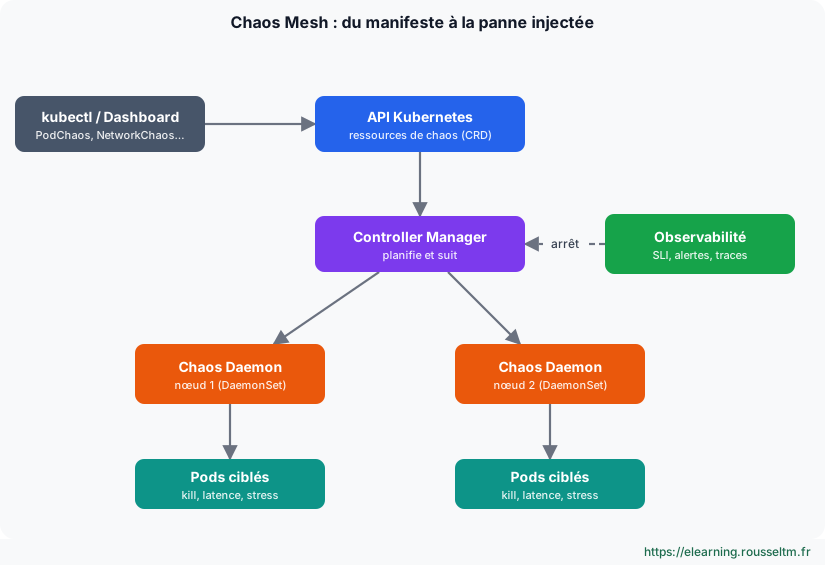
Experiment 1: delete a pod #
Hypothesis: with three replicas and a readiness probe, deleting an API pod does not lower the success rate below 99.9%.
apiVersion: chaos-mesh.org/v1alpha1
kind: PodChaos
metadata: { name: api-pod-kill, namespace: boutique }
spec:
  action: pod-kill
  mode: one                 # un seul pod : rayon d'impact minimal
  selector:
    namespaces: [boutique]
    labelSelectors: { app: api }
kubectl apply -f api-pod-kill.yaml
kubectl get pods -n boutique -l app=api -w # un pod est recréé
kubectl delete -f api-pod-kill.yaml # fin de l'expérience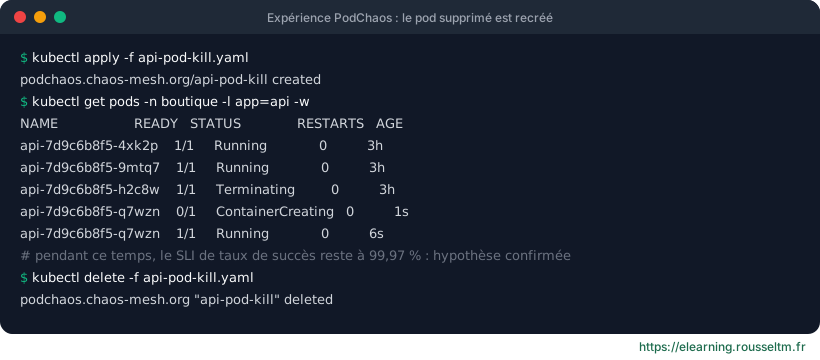
Experiment 2: add network latency #
Hypothesis: if the database responds 200 ms slower, the API p99 stays below 800 ms thanks to the cache.
apiVersion: chaos-mesh.org/v1alpha1
kind: NetworkChaos
metadata: { name: db-latence, namespace: boutique }
spec:
  action: delay
  mode: all
  selector: { namespaces: [boutique], labelSelectors: { app: postgres } }
  delay: { latency: 200ms, jitter: 20ms }
  duration: 5m
Good practice: During the experiment, watch the latency SLI, the API traces and whether the burn rate alerts fire: an alert that does not fire while users suffer is also a lesson.
A declarative experiment with Chaos Toolkit #
{
  "title": "L'API tolère la perte d'un pod",
  "steady-state-hypothesis": {
    "title": "L'API répond",
    "probes": [{ "type": "probe", "name": "api-ok", "tolerance": 200,
                 "provider": { "type": "http", "url": "https://api.exemple.fr/healthz" } }]
  },
  "method": [{ "type": "action", "name": "supprimer-un-pod",
               "provider": { "type": "python", "module": "chaosk8s.pod.actions",
                             "func": "terminate_pods",
                             "arguments": { "label_selector": "app=api", "ns": "boutique", "qty": 1 } } }],
  "rollbacks": []
}
pip install chaostoolkit chaostoolkit-kubernetes
chaos run experience.json # vérifie l'hypothèse avant et après l'injection7. Running game days #
Prepare, run, debrief.
How a game day unfolds #
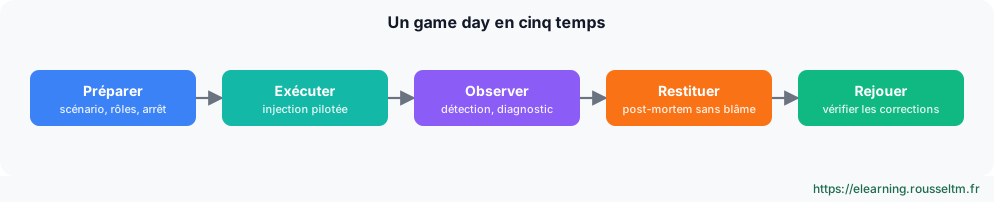
- Prepare: choose a realistic scenario, the hypothesis, the participants (teams involved, on-call), the stop conditions and the communication.
- Execute: a facilitator injects the failure, teams detect and respond as in a real incident.
- Observe: record time to detect, diagnose and recover, and the alerts received or missing.
- Debrief: blameless post-mortem, corrective actions with owners and deadlines.
- Replay later to verify the fixes.
Pitfalls to avoid #
- Experimenting without observability or SLOs: there is no way to know whether the hypothesis holds.
- Starting with a large-scale failure in production.
- Not warning teams and support during the first experiments.
- Not following up on corrective actions: the same weaknesses come back.
- Confusing chaos engineering with load testing: the two are complementary.
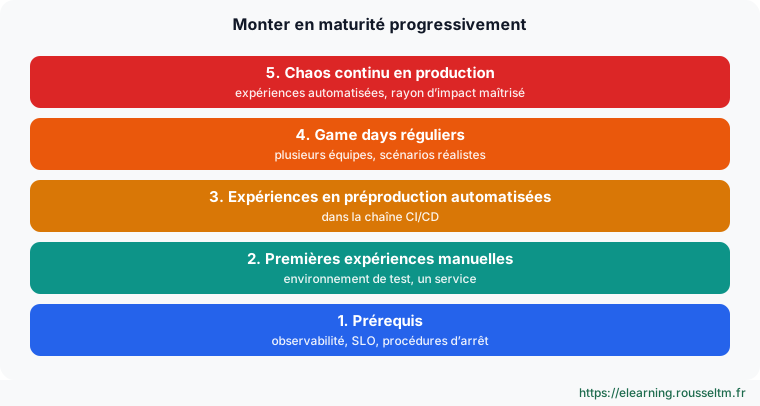
Good practice: Gradually add automated experiments to the CI/CD pipeline (pre-production): every release is then checked against known failures.
My progress
Sign in to track your progress and take notes. Sign in
💬 Recent discussions about this course
- Alerter sur un SLO de 99,9 % sans être réveillé pour rien✓ solved · 1 reply(ies)
Ask a question about this lesson →See all discussions about this course
Recommended Articles
The error budget: making decisions with SLOs
Calculate and track an error budget, write an error budget policy and use it to arbitrate between...
SRE best practices: useful SLOs and respected budgets
Checklist for setting up SLOs that matter: choosing user journeys, realistic objectives, budget p...
Time-based vs event-based SLO: understanding, computing and choosing (with the Qonto example)
Differences between time-based SLOs (time slices, uptime) and event-based SLOs (good events over ...
SRE: SLI, SLO and SLA explained simply
The fundamentals of Site Reliability Engineering (SRE): the difference between SLI, SLO and SLA, ...
Alerting on error budget burn rate (multi-window burn rate)
Why alert on burn rate rather than a threshold, and how to build the multi-window, multi-burn-rat...
Managing SLOs with Pyrra
Pyrra: define availability and latency SLOs as Kubernetes CRDs or files, generate Prometheus rule...
SLOs in Dynatrace: objectives, error budget and burn rate
SLI, SLO and SLA, error budget and burn rate: defining an availability or performance SLO in Dyna...
Service-Level Objectives (new platform) in Dynatrace
Defining and steering SLOs in the Dynatrace Service-Level Objectives app: templates and custom DQ...
Grafana SLO in Grafana Cloud
Grafana SLO in Grafana Cloud: SLI, objective and error budget, creating a ratio SLO, fast and slo...