Introduction to SLO - SLI - SLA - SRE
 Watch the video
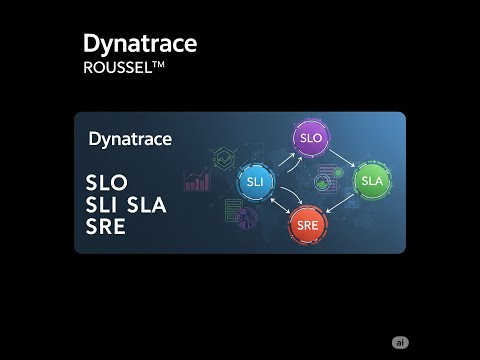
Plongez au cœur de l'observabilité avec Dynatrace et comprenez les concepts clés qui guident les équipes SRE ! 🚀 Dans cette vidéo, nous allons démystifier les SLO (Service Level Objectives), les SLI (Service Level Indicators), les SLA (Service Level Agreements) et le rôle du SRE (Site Reliability Engineering). Apprenez comment Dynatrace vous aide à définir, mesurer et atteindre ces objectifs de performance cruciaux pour la fiabilité de vos applications.

Ce que vous allez apprendre dans cette vidéo 📚
Définir et différencier SLO, SLI et SLA.

Comprendre le rôle du SRE dans l'écosystème de l'observabilité.

Comment Dynatrace aide à mesurer les SLI et à suivre les SLO.

Utiliser les Error Budgets pour une gestion proactive des risques.

Aligner les objectifs techniques avec les attentes métier.

Pourquoi c'est incontournable pour vous ? 💡
Maîtriser ces concepts est essentiel pour toute équipe cherchant à construire et maintenir des systèmes fiables et performants. Cette vidéo vous permettra de :

Améliorer la fiabilité de vos services et la satisfaction de vos utilisateurs.

Prendre des décisions basées sur des données concrètes pour l'amélioration continue.

Faciliter la collaboration entre les équipes de développement et d'opérations.

Optimiser l'allocation des ressources et les efforts de maintenance.

Prêt à propulser votre observabilité avec les SLO, SLI, SLA et le SRE ? C'est parti ! 🚀

👉 Pour aller plus loin et maîtriser Dynatrace, découvrez nos formations complètes : https://elearning.rousseltm.fr

N'oubliez pas de vous abonner à la chaîne pour ne manquer aucune de nos futures vidéos sur Dynatrace, l'observabilité et le SRE ! 🔔
Laissez un pouce bleu si cette vidéo vous a été utile et partagez-la avec vos collègues ! 👍
Course Glossary
The use of artificial intelligence and machine learning to automate and improve IT operations (e.g., anomaly detection, reducing alert noise).
An open source framework providing standards, APIs, and SDKs to collect and export observability data (traces, metrics, logs) in an agnostic way.
Recommended Articles
Understand the evolution of billing in Dynatrace: the difference between the ...
Discover why and how to configure Grafana Alloy so that it monitors itself, c...
Discover how to enable, secure, and use Grafana Alloy's built-in web interfac...
Discover the fundamental concepts of Grafana Alloy, the transition from the s...
Master Grafana Alloy's declarative syntax (River language), learn to manipula...
Learn how to configure Grafana Alloy to collect, transform, and forward metri...
Discover how to configure Grafana Alloy to read log files, journald, or netwo...
Dive into distributed trace processing. Learn how to ingest OTLP, Jaeger, or ...
Discover how to configure continuous profiling in your environments using Gra...
Learn how to manage large-scale Grafana Alloy deployments. Configure Clusteri...
Discover Grafana Assistant, the artificial intelligence integrated into Grafa...
Comparison between Grafana Alloy and Dynatrace ActiveGate. Understand the fun...