1. Aggregation families #
Group, compute, chain.
Three families #
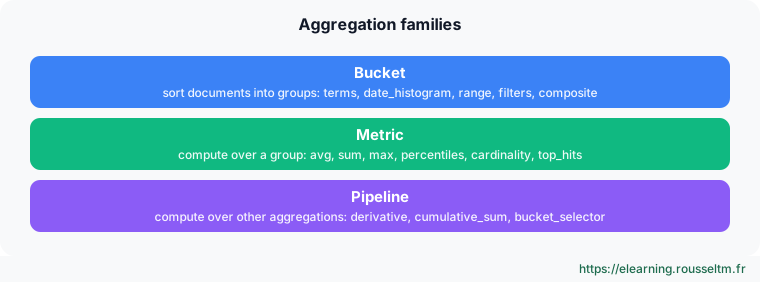
Good to know : Requests are written in the OpenSearch Dashboards Dev Tools console format (GET _cluster/health). On the command line, the same request iscurl -sk -u 'admin:Str0ng!Passw0rd-2026' https://localhost:9200/_cluster/health, with-H 'Content-Type: application/json' -d '…'when there is a body.
Error rate per service and per hour #
GET logs-app-*/_search
{
  "size": 0,
  "query": {"range": {"@timestamp": {"gte": "now-24h"}}},
  "aggs": {
    "par_heure": {
      "date_histogram": {"field": "@timestamp", "fixed_interval": "1h", "time_zone": "Europe/Paris"},
      "aggs": {
        "par_service": {
          "terms": {"field": "service", "size": 10},
          "aggs": {
            "erreurs": {"filter": {"term": {"level": "ERROR"}}},
            "p95": {"percentiles": {"field": "duree_ms", "percents": [95]}}
          }
        }
      }
    }
  }
}
size: 0 avoids returning documents: only aggregations matter. fixed_interval takes a fixed duration (1h, 5m); calendar_interval follows the calendar (1M for a real month).
2. Aggregations to know #
And their pitfalls.
Selection #
| Aggregation | Use | Pitfall |
|---|---|---|
| terms | top N values | approximate counts over several shards (doc_count_error_upper_bound) |
| cardinality | distinct value count (unique users) | approximate (HyperLogLog++), exact below precision_threshold |
| percentiles | p50, p95, p99 latency | approximate (t-digest) |
| composite | walk all combinations, page by page | no sort by count |
| top_hits | sample documents per group | costly with many groups |
| significant_terms | what is unusually frequent in a subset | needs enough data |
Pipeline aggregations #
GET logs-app-*/_search
{
  "size": 0,
  "aggs": {
    "par_minute": {
      "date_histogram": {"field": "@timestamp", "fixed_interval": "1m"},
      "aggs": {
        "volume": {"value_count": {"field": "@timestamp"}},
        "variation": {"derivative": {"buckets_path": "volume"}},
        "pics": {"bucket_selector": {"buckets_path": {"v": "volume"}, "script": "params.v > 1000"}}
      }
    }
  }
}
derivative computes the minute-to-minute change; bucket_selector keeps only minutes above 1,000 events.
Walking everything with composite #
GET logs-app-*/_search
{
  "size": 0,
  "aggs": {
    "couples": {
      "composite": {
        "size": 500,
        "sources": [{"service": {"terms": {"field": "service"}}}, {"niveau": {"terms": {"field": "level"}}}]
      }
    }
  }
}
The response contains after_key: send it back in "after" to get the next page, until an empty response.
3. Exploring with PPL #
The shell-like language.
Principle #
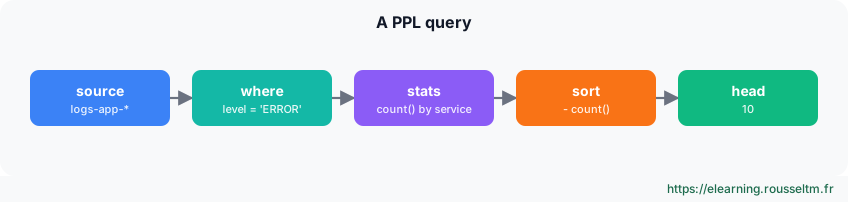
| Command | Role | Example |
|---|---|---|
| where | filter | where level = 'ERROR' and duree_ms > 1000 |
| fields | pick fields | fields @timestamp, service, message |
| stats | aggregate | stats avg(duree_ms), count() by service |
| eval | compute a field | eval secondes = duree_ms / 1000 |
| sort / head | sort, limit | sort - duree_ms | head 20 |
| dedup | deduplicate | dedup utilisateur |
| top / rare | frequent or rare values | top 5 service |
| parse | extract with a regex | parse message 'utilisateur=(? |
| patterns | group similar messages | patterns message | stats count() by patterns_field |
Examples #
source=logs-app-* | where level = 'ERROR' | stats count() as erreurs by span(@timestamp, 1h), service | sort - erreurs

source=logs-app-* | parse message 'utilisateur=(?<utilisateur>\w+)' | where isnotnull(utilisateur) | top 5 utilisateur

source=web-logs | eval lent = if(duree_ms > 1000, 1, 0) | stats sum(lent) as lentes, count() as total by request | eval taux = lentes * 100 / total | sort - taux | head 10
Good to know : Versions 3.x extend PPL (new query engine, joins and subqueries depending on the version). Check your version's command list in the documentation.
4. SQL and Query Workbench #
For those who think in tables.
SQL #
SELECT service, COUNT(*) AS n, AVG(duree_ms) AS moyenne
FROM logs-app-*
WHERE level = 'ERROR' AND @timestamp > NOW() - INTERVAL 1 DAY
GROUP BY service
ORDER BY n DESC
LIMIT 10
The console's Query Workbench runs SQL and PPL, shows the plan (_explain) and exports to CSV or JSON. Via API: POST _plugins/_sql?format=csv.
| Language | Strengths |
|---|---|
| DSL | anything is possible, used by applications |
| PPL | interactive log exploration, readable chaining |
| SQL | reports, BI tools (JDBC and ODBC drivers) |
Commands to know #
Commands to know
POST _plugins/_ppl: run a PPL queryPOST _plugins/_sql?format=csv: run SQL, CSV responsePOST _plugins/_sql/_explain: query translated to DSL"size": 0, "aggs": {…}: aggregate without returning documents
Sources #
Checked in November 2026 (OpenSearch 3.x, Data Prepper 2.x): OpenSearch ships a minor release about every six weeks, check the release notes before relying on a detail.