1. The problem with dashboard-wide variables #
A dashboard variable filters every panel at once.
One filter for the whole dashboard #
Available in: ✓ OSS ✓ Enterprise ✓ Cloud Generally available since June 2026 (Grafana 13, dynamic dashboards)
Until now, a variable such as $instance belonged to the whole dashboard: changing its value changed every panel. Yet one dashboard often groups different services, for example an API gateway and a database, whose instances have nothing in common. Choosing gw-01 then emptied the database panels, and vice versa.
The usual workarounds #
- Split into several dashboards: each has its own filters, but you lose the overall view and correlation over the same time range.
- Multiply variables (
$gw_instance,$db_instance…): the variable bar grows and nobody knows which filter affects which panel. - Repeat a row per value: useful to compare values, not to filter two services differently.
2. What section-level variables bring #
Each row or tab can have its own variables.
The principle #
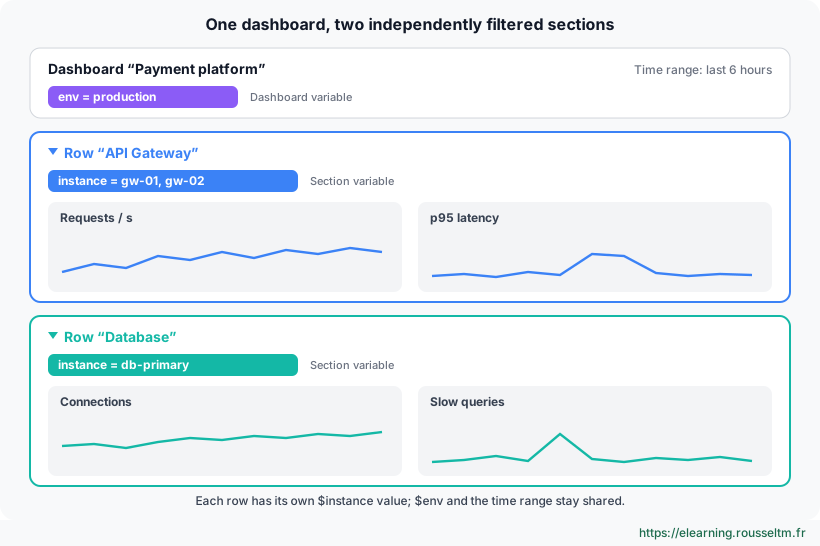
A section-level variable is defined on a row or tab of the dashboard and only applies to the panels in that grouping. Other sections are unaffected, and all of them keep sharing the same time range.
Timeline and prerequisites #
- April 2026: public preview, as part of Grafana 13 dynamic dashboards.
- June 2026: general availability.
- Rows and tabs are those of dynamic dashboards (dashboard schema v2, Grafana 13's default format): a dashboard is migrated to this format when opened.
- Nothing changes for existing dashboards until you add a variable to a row or tab.
Where does it fit? #
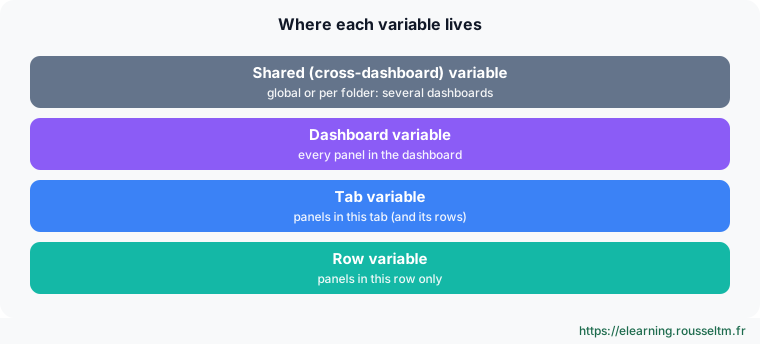
Section-level variables complement dashboard variables and variables shared across dashboards: the narrower the scope, the closer the variable is to the panels it filters.
3. Enabling the feature #
Grafana Cloud and self-managed Grafana.
Grafana Cloud #
The feature was rolled out gradually to Grafana Cloud stacks: if the Variables option does not appear yet in a row's configuration, it will arrive without any action on your part.
Self-managed Grafana (OSS and Enterprise) #
Use Grafana 13. If the option does not show up in your version, enable the dashboardSectionVariables feature toggle, then restart Grafana:
# grafana.ini (self-managed Grafana)
[feature_toggles]
enable = dashboardSectionVariables
# Docker: same setting through an environment variable
docker run -d -p 3000:3000 \
-e GF_FEATURE_TOGGLES_ENABLE=dashboardSectionVariables \
grafana/grafana:latestBest practice : Check feature status under Administration › Feature toggles (depending on the version) or in Grafana's startup logs.
4. Creating a section-level variable, step by step #
From the dashboard edit mode.
Step by step #
- Open the dashboard and switch to edit mode.
- If needed, create a row or tab grouping the panels of one service, then select it.
- In the grouping's configuration sidebar, open the Variables section (“variables that apply to only the panels in the grouping”).
- Add a variable: same form as for a dashboard variable (type, name, query, multi-value, “All” option).
- Use it in the queries of the section's panels, then save the dashboard.
Good to know : In the query editor, autocompletion only suggests variables available to the panel being edited: those of its section, parent sections and the dashboard.
Variable types #
Every variable type is accepted at section level (query, custom, interval, constant, text box, data source, filters…), with one exception: the Filter and group by feature, still in preview in Grafana 13, is not supported for now.
5. Resolution order and precedence #
Section first, dashboard next.
The rule #
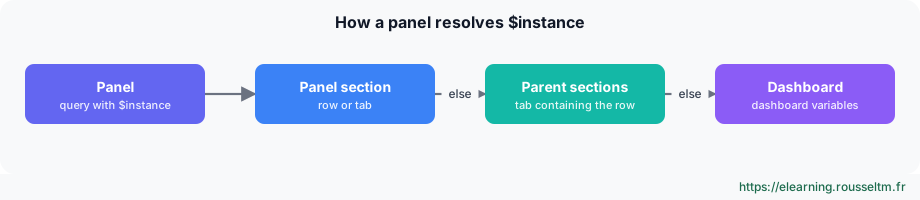
A panel first resolves the variables of its section, then those of parent sections (a tab containing the row), and finally falls back on dashboard variables.
Same name, two values #
A direct consequence: if a row defines an instance variable while the dashboard already has one, the row's panels use the row's variable, and other panels use the dashboard's. So keep the same name ($instance) in every section: queries stay identical across services, only the list of values changes.
Building on a dashboard variable #
A section-level variable can use a dashboard variable in its query: $env stays a shared filter, and each row offers the instances of that environment.
6. Full example: API gateway and database #
One dashboard, two services, two instance lists.
The variables #
| Level | Name | Query (Prometheus) |
|---|---|---|
| Dashboard | env | label_values(up, env) |
| Row “API Gateway” | instance | label_values(up{job="api-gateway", env="$env"}, instance) |
| Row “Database” | instance | label_values(pg_up{env="$env"}, instance) |
The panels #
In the API Gateway row:
sum by (instance) (rate(http_requests_total{job="api-gateway", env="$env", instance=~"$instance"}[5m]))In the Database row:
sum by (instance) (pg_stat_activity_count{env="$env", instance=~"$instance"})Both queries use $instance, but each row gives it its own value. Changing the gateway instance leaves the database panels untouched, and changing $env updates both rows.
7. Rows, tabs, repeats and nesting #
Variables follow the dashboard structure.
What is kept #
- Converting a row into a tab (or the other way round), or changing layout, keeps the section's variables.
- Section-level variables work with repeated rows and tabs: each copy keeps the section's filters.
- Ungrouping does not delete its variables: they move up to the next level.
- Groupings nest up to four levels deep (tabs containing rows, for example), each of which can have its own variables.
Repeat or section-level variable? #
A repeated row duplicates the same panels for each value of a variable (one row per region, for example): it is the comparison tool. A section-level variable filters part of the dashboard without duplicating anything: it is the tool for different services gathered in one dashboard.
8. Limits, best practices and exercise #
What to remember before restructuring your dashboards.
Limits #
- The time range stays common to the whole dashboard: a section cannot have its own time range.
- Filter and group by (Grafana 13 preview) is not available at section level yet.
- Rows and tabs are those of dynamic dashboards: a dashboard still in the classic format must first be opened and saved in Grafana 13.
Best practices #
- Put truly shared filters (
$env,$cluster) at dashboard level and service-dependent ones at section level. - Keep identical names across sections to reuse the same queries.
- With Git Sync or provisioning, section-level variables are stored in the dashboard JSON: review them like everything else.
- For a filter useful to several dashboards, prefer a variable shared across dashboards.
| Need | Tool |
|---|---|
| One filter for the whole dashboard | Dashboard variable |
| One filter for part of the dashboard | Section-level variable (row or tab) |
| The same filter in several dashboards | Shared (cross-dashboard) variable |
| The same panels for each value | Repeated row or tab |
Your turn #
- In Grafana 13, create a dashboard with a
jobdashboard variable. - Add two rows, “Prometheus” and “Node exporter”, each with an
instancesection-level variable listing only its job's instances. - Add an
up{instance=~"$instance"}panel to each row and check that changing one row's instance does not affect the other. - Convert the first row into a tab: the variable must be kept.
