1. Organizations, teams and folders #
The three levels of grouping and sharing.
The hierarchy #
Available in: ✓ OSS ✓ Enterprise ✓ Cloud
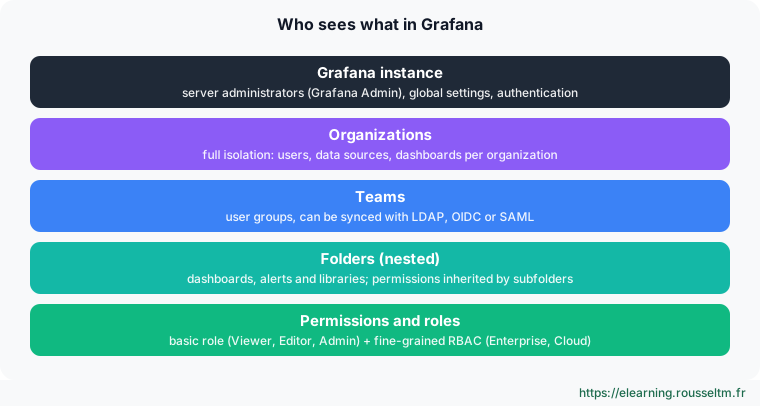
- Organization: a sealed space (users, data sources, dashboards, alerts). Keep it for real separation, for example different customers: nothing is shared between organizations.
- Team: a group of users within an organization, granted permissions. It is the right level for “Production”, “Infrastructure” or “Development”.
- Folder: holds dashboards, alert rules and library panels. Folders can be nested and subfolders inherit permissions.
One organization or teams? #
Best practice : Start with a single organization, teams and one folder per team. Multiple organizations duplicate data sources and prevent any cross-team dashboard.
2. Roles, permissions and RBAC #
From basic roles to fine-grained control.
Basic roles #
| Role | Can… |
|---|---|
| Grafana Admin | administer the instance: organizations, users, settings (server role) |
| Admin | administer an organization: data sources, teams, users, plugins |
| Editor | create and edit dashboards and alerts, explore data |
| Viewer | view permitted dashboards |
| No basic role | nothing by default: every right comes from explicit permissions (folders, teams) |
Folder and dashboard permissions #
On each folder, grant View, Edit or Admin to a user, team or role. Remove the default “Viewer: view” permission from sensitive folders, otherwise everyone sees them.
RBAC and data source permissions #
Available in: ✕ OSS ✓ Enterprise ✓ Cloud
- RBAC adds fixed roles (for example “Data sources reader”, “Alerting writer”) and custom roles, assignable to users, teams and service accounts.
- Data source permissions restrict who can query a source: without them (Grafana OSS), any user who can see a dashboard can query every data source in the organization from Explore.
Watch out : In OSS, a team that must not see some data has to be placed in another organization, with its own data sources: hiding a dashboard does not protect the data source.
3. Service accounts and tokens #
Access for scripts, CI and Terraform.
Why service accounts? #
A service account is a technical identity with a role and permissions, holding one or more tokens (glsa_ prefix). It replaces the old API keys, which were migrated automatically: never use a person's account for a script.
# “ci-dashboards” service account with the Editor role, then a token valid for 90 days
curl -s -H "Authorization: Bearer $TOKEN" -H 'Content-Type: application/json' \
  -X POST $GRAFANA/api/serviceaccounts -d '{"name":"ci-dashboards","role":"Editor"}'
curl -s -H "Authorization: Bearer $TOKEN" -H 'Content-Type: application/json' \
  -X POST $GRAFANA/api/serviceaccounts/2/tokens -d '{"name":"gitlab-ci","secondsToLive":7776000}'
Security rules #
- One service account per use (CI, Terraform, backup), with the lowest possible role.
- Time-limited tokens, stored in a secret vault and rotated.
- Revoke an exposed token immediately (Git repository, log): it grants the service account rights.
Automating teams and folders #
export GRAFANA=https://grafana.exemple.fr
export TOKEN=glsa_xxx          # token of a service account with the organization Admin role
# Create a team
curl -s -H "Authorization: Bearer $TOKEN" -H 'Content-Type: application/json' \
  -X POST $GRAFANA/api/teams -d '{"name":"Production"}'
# Create a folder and reserve it for the team (permission 1 = view, 2 = edit, 4 = admin)
curl -s -H "Authorization: Bearer $TOKEN" -H 'Content-Type: application/json' \
  -X POST $GRAFANA/api/folders -d '{"uid":"prod","title":"Production"}'
curl -s -H "Authorization: Bearer $TOKEN" -H 'Content-Type: application/json' \
  -X POST $GRAFANA/api/folders/prod/permissions \
  -d '{"items":[{"teamId":1,"permission":2},{"role":"Viewer","permission":1}]}'
4. Authentication: LDAP, OIDC, SAML and auth proxy #
Plugging Grafana into the company directory.
Which method? #
| Method | Editions | Use |
|---|---|---|
| LDAP / Active Directory | OSS, Enterprise | internal directory; roles mapped from groups |
| OAuth 2 / OIDC | OSS, Enterprise, Cloud | Keycloak, Microsoft Entra ID, Okta, Google, GitLab…: today's default choice |
| SAML | Enterprise, Cloud | enterprise identity providers without OIDC |
| Auth proxy | OSS, Enterprise | an already authenticated reverse proxy passes the identity in a header |
| Team sync | Enterprise, Cloud | Grafana team membership taken from the provider's groups |
OIDC #
# grafana.ini: sign in through an OIDC provider (here Keycloak)
[auth.generic_oauth]
enabled = true
name = Keycloak
client_id = grafana
client_secret = $__file{/run/secrets/grafana_oidc_secret}
scopes = openid email profile groups
auth_url = https://sso.exemple.fr/realms/it/protocol/openid-connect/auth
token_url = https://sso.exemple.fr/realms/it/protocol/openid-connect/token
api_url = https://sso.exemple.fr/realms/it/protocol/openid-connect/userinfo
# Grafana role derived from the identity provider's groups
role_attribute_path = contains(groups[*], 'grafana-admins') && 'Admin' || contains(groups[*], 'grafana-editors') && 'Editor' || 'Viewer'
allow_sign_up = true
LDAP #
# grafana.ini
[auth.ldap]
enabled = true
config_file = /etc/grafana/ldap.toml

# ldap.toml (extrait)
[[servers]]
host = "ldap.exemple.fr"
port = 636
use_ssl = true
bind_dn = "cn=grafana,ou=services,dc=exemple,dc=fr"
bind_password = "$__file{/run/secrets/ldap_password}"
search_filter = "(uid=%s)"
search_base_dns = ["ou=people,dc=exemple,dc=fr"]
[[servers.group_mappings]]
group_dn = "cn=supervision-admins,ou=groups,dc=exemple,dc=fr"
org_role = "Admin"
[[servers.group_mappings]]
group_dn = "*"
org_role = "Viewer"
Auth proxy #
# grafana.ini: the reverse proxy authenticates and passes the username in a header
[auth.proxy]
enabled = true
header_name = X-WEBAUTH-USER
header_property = username
auto_sign_up = true
whitelist = 10.0.0.10, 10.0.0.11      # only the proxy addresses may supply the header
Watch out : Without a whitelist, anyone able to reach Grafana could send the header and sign in as anyone. Grafana must only be reachable through the proxy.
5. Protecting secrets #
Data source passwords, keys and tokens.
What Grafana encrypts #
Passwords and tokens of data sources, alert contact points and plugins are encrypted in the database with the secret_key (envelope encryption). Losing this key makes those secrets unreadable: back it up separately, and use the same one on every instance.
Keep secrets out of plain text #
- In
grafana.iniand provisioning, read values from a file or the environment:$__file{/run/secrets/x},$__env{VAR}. - Grafana Enterprise can also read secrets from HashiCorp Vault (
$__vault{…}) and delegate the encryption key to a KMS (AWS, Azure, Google Cloud, Vault). - Disable open sign-up (
allow_sign_up = falsefor local login) and change the initialadminpassword.
Commands to know #
Commands to know
grafana cli admin reset-admin-password <mdp>: reset the administrator passwordGET /api/org/users: list organization users and their rolePOST /api/teams: create a teamPOST /api/folders/:uid/permissions: set a folder's permissionsPOST /api/serviceaccounts: create a service accountPOST /api/serviceaccounts/:id/tokens: create a token (secondsToLive)$__file{/run/secrets/x}: read a secret from a file in the configuration
