1. Organizations, teams and folders #
The three levels of grouping and sharing.
The hierarchy #
Available in: ✓ OSS ✓ Enterprise ✓ Cloud
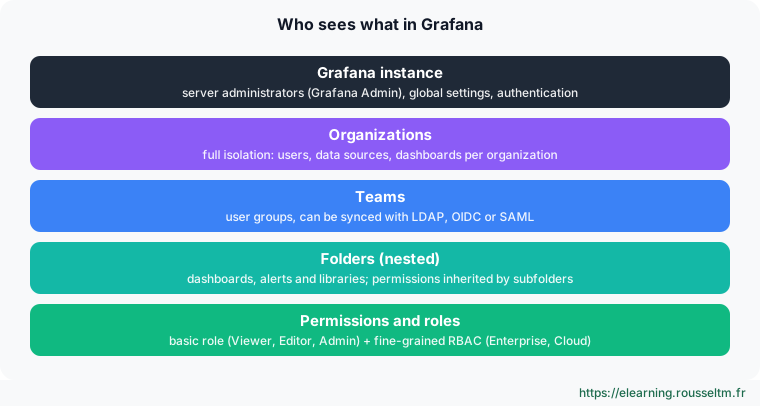
- Organization: a sealed space (users, data sources, dashboards, alerts). Keep it for real separation, for example different customers: nothing is shared between organizations.
- Team: a group of users within an organization, granted permissions. It is the right level for “Production”, “Infrastructure” or “Development”.
- Folder: holds dashboards, alert rules and library panels. Folders can be nested and subfolders inherit permissions.
One organization or teams? #
Best practice : Start with a single organization, teams and one folder per team. Multiple organizations duplicate data sources and prevent any cross-team dashboard.
2. Roles, permissions and RBAC #
From basic roles to fine-grained control.
Basic roles #
| Role | Can… |
|---|---|
| Grafana Admin | administer the instance: organizations, users, settings (server role) |
| Admin | administer an organization: data sources, teams, users, plugins |
| Editor | create and edit dashboards and alerts, explore data |
| Viewer | view permitted dashboards |
| No basic role | nothing by default: every right comes from explicit permissions (folders, teams) |
Folder and dashboard permissions #
On each folder, grant View, Edit or Admin to a user, team or role. Remove the default “Viewer: view” permission from sensitive folders, otherwise everyone sees them.
RBAC and data source permissions #
Available in: ✕ OSS ✓ Enterprise ✓ Cloud
- RBAC adds fixed roles (for example “Data sources reader”, “Alerting writer”) and custom roles, assignable to users, teams and service accounts.
- Data source permissions restrict who can query a source: without them (Grafana OSS), any user who can see a dashboard can query every data source in the organization from Explore.
Watch out : In OSS, a team that must not see some data has to be placed in another organization, with its own data sources: hiding a dashboard does not protect the data source.
3. Service accounts and tokens #
Access for scripts, CI and Terraform.
Why service accounts? #
A service account is a technical identity with a role and permissions, holding one or more tokens (glsa_ prefix). It replaces the old API keys, which were migrated automatically: never use a person's account for a script.
# “ci-dashboards” service account with the Editor role, then a token valid for 90 days
curl -s -H "Authorization: Bearer $TOKEN" -H 'Content-Type: application/json' \
  -X POST $GRAFANA/api/serviceaccounts -d '{"name":"ci-dashboards","role":"Editor"}'
curl -s -H "Authorization: Bearer $TOKEN" -H 'Content-Type: application/json' \
  -X POST $GRAFANA/api/serviceaccounts/2/tokens -d '{"name":"gitlab-ci","secondsToLive":7776000}'
Security rules #
- One service account per use (CI, Terraform, backup), with the lowest possible role.
- Time-limited tokens, stored in a secret vault and rotated.
- Revoke an exposed token immediately (Git repository, log): it grants the service account rights.
Automating teams and folders #
export GRAFANA=https://grafana.exemple.fr
export TOKEN=glsa_xxx          # token of a service account with the organization Admin role
# Create a team
curl -s -H "Authorization: Bearer $TOKEN" -H 'Content-Type: application/json' \
  -X POST $GRAFANA/api/teams -d '{"name":"Production"}'
# Create a folder and reserve it for the team (permission 1 = view, 2 = edit, 4 = admin)
curl -s -H "Authorization: Bearer $TOKEN" -H 'Content-Type: application/json' \
  -X POST $GRAFANA/api/folders -d '{"uid":"prod","title":"Production"}'
curl -s -H "Authorization: Bearer $TOKEN" -H 'Content-Type: application/json' \
  -X POST $GRAFANA/api/folders/prod/permissions \
  -d '{"items":[{"teamId":1,"permission":2},{"role":"Viewer","permission":1}]}'
4. Authentication: LDAP, OIDC, SAML and auth proxy #
Plugging Grafana into the company directory.
Which method? #
| Method | Editions | Use |
|---|---|---|
| LDAP / Active Directory | OSS, Enterprise | internal directory; roles mapped from groups |
| OAuth 2 / OIDC | OSS, Enterprise, Cloud | Keycloak, Microsoft Entra ID, Okta, Google, GitLab…: today's default choice |
| SAML | Enterprise, Cloud | enterprise identity providers without OIDC |
| Auth proxy | OSS, Enterprise | an already authenticated reverse proxy passes the identity in a header |
| Team sync | Enterprise, Cloud | Grafana team membership taken from the provider's groups |
OIDC #
# grafana.ini: sign in through an OIDC provider (here Keycloak)
[auth.generic_oauth]
enabled = true
name = Keycloak
client_id = grafana
client_secret = $__file{/run/secrets/grafana_oidc_secret}
scopes = openid email profile groups
auth_url = https://sso.exemple.fr/realms/it/protocol/openid-connect/auth
token_url = https://sso.exemple.fr/realms/it/protocol/openid-connect/token
api_url = https://sso.exemple.fr/realms/it/protocol/openid-connect/userinfo
# Grafana role derived from the identity provider's groups
role_attribute_path = contains(groups[*], 'grafana-admins') && 'Admin' || contains(groups[*], 'grafana-editors') && 'Editor' || 'Viewer'
allow_sign_up = true
LDAP #
# grafana.ini
[auth.ldap]
enabled = true
config_file = /etc/grafana/ldap.toml

# ldap.toml (extrait)
[[servers]]
host = "ldap.exemple.fr"
port = 636
use_ssl = true
bind_dn = "cn=grafana,ou=services,dc=exemple,dc=fr"
bind_password = "$__file{/run/secrets/ldap_password}"
search_filter = "(uid=%s)"
search_base_dns = ["ou=people,dc=exemple,dc=fr"]
[[servers.group_mappings]]
group_dn = "cn=supervision-admins,ou=groups,dc=exemple,dc=fr"
org_role = "Admin"
[[servers.group_mappings]]
group_dn = "*"
org_role = "Viewer"
Auth proxy #
# grafana.ini: the reverse proxy authenticates and passes the username in a header
[auth.proxy]
enabled = true
header_name = X-WEBAUTH-USER
header_property = username
auto_sign_up = true
whitelist = 10.0.0.10, 10.0.0.11      # only the proxy addresses may supply the header
Watch out : Without a whitelist, anyone able to reach Grafana could send the header and sign in as anyone. Grafana must only be reachable through the proxy.
5. Protecting secrets #
Data source passwords, keys and tokens.
What Grafana encrypts #
Passwords and tokens of data sources, alert contact points and plugins are encrypted in the database with the secret_key (envelope encryption). Losing this key makes those secrets unreadable: back it up separately, and use the same one on every instance.
Keep secrets out of plain text #
- In
grafana.iniand provisioning, read values from a file or the environment:$__file{/run/secrets/x},$__env{VAR}. - Grafana Enterprise can also read secrets from HashiCorp Vault (
$__vault{…}) and delegate the encryption key to a KMS (AWS, Azure, Google Cloud, Vault). - Disable open sign-up (
allow_sign_up = falsefor local login) and change the initialadminpassword.
Commands to know #
Commands to know
grafana cli admin reset-admin-password <mdp>: reset the administrator passwordGET /api/org/users: list organization users and their rolePOST /api/teams: create a teamPOST /api/folders/:uid/permissions: set a folder's permissionsPOST /api/serviceaccounts: create a service accountPOST /api/serviceaccounts/:id/tokens: create a token (secondsToLive)$__file{/run/secrets/x}: read a secret from a file in the configuration
My progress
Sign in to track your progress and take notes. Sign in
💬 Recent discussions about this course
- Grafana : une variable « service » qui dépend de la variable « environnement »✓ solved · 1 reply(ies)
Ask a question about this lesson →See all discussions about this course
Course Glossary
Alerting
The process of notifying teams (via email, Slack, Teams) when a specific event, threshold breach, or anomaly is detected.
HTTP Code 200 (OK)
An HTTP status code indicating that the client's request was successfully processed by the server.
HTTP Code 403 (Forbidden)
An HTTP status code indicating that the server understood the request but refuses to authorize it, usually due to a lack of permissions.
HTTP Code 404 (Not Found)
An HTTP status code indicating that the requested resource could not be found on the server.
Grafana
An open-source interactive data visualization platform that allows users to create, explore, and share analytic dashboards from multiple time-series d...
Recommended Articles
Enterprise features
Grafana Enterprise features (also in paid Grafana Cloud tiers): fine-grained RBAC, data source pe...
Automating Grafana: HTTP API, Terraform and dashboard lifecycle
Industrializing Grafana: HTTP API (folders, dashboards, users, data sources), Terraform provider,...
Grafana best practices: dashboards, provisioning, performance and security
Grafana best practices: designing readable dashboards, variables, dashboards as code, provisionin...
Correlations in Grafana: jump from one data source to another
Create links between data sources in Explore: query and external correlations, variables, regex a...
Git Sync in Grafana: version dashboards in GitHub
Sync Grafana dashboards and folders with a GitHub repository: prerequisites, token, setup in Admi...
Grafana announcement banner: inform every user
Show a message at the top of every Grafana page: enabling it, the Message field with Markdown and...
Grafana provisioning: automate the management of your dashboards and data sources
Learn how to use Grafana provisioning to manage your configuration (dashboards, data sources, not...
Costs, usage and Private Data Source Connect in Grafana Cloud
Costs, usage and Private Data Source Connect in Grafana Cloud: billing units, free tier, usage tr...
Grafana Assistant: AI at the service of observability
Discover Grafana Assistant, Grafana's AI assistant (Cloud, OSS and Enterprise). Learn how this la...