1. Alerts #
From stream to notification.
The chain #
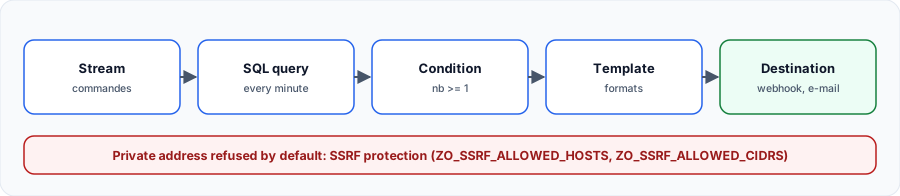
Creation order matters: the template, then the destination using it, then the alert. We tested this chain with a real webhook, which received: {"alerte":"erreurs_paiement","flux":"commandes","nb":"1"}.
A='root@example.com:Complexpass#123'
curl -u "$A" -H 'Content-Type: application/json' \
  http://localhost:5080/api/default/alerts/templates \
  -d '{"name":"tpl_simple","type":"http","title":"",
       "body":"{\"alerte\":\"{alert_name}\",\"flux\":\"{stream_name}\",\"nb\":\"{alert_count}\"}"}'

curl -u "$A" -H 'Content-Type: application/json' \
  http://localhost:5080/api/default/alerts/destinations \
  -d '{"name":"webhook_tp","url":"http://echo:8080/alerte","method":"post",
       "skip_tls_verify":false,"template":"tpl_simple","headers":{},"type":"http"}'
A='root@example.com:Complexpass#123'
curl -u "$A" -H 'Content-Type: application/json' \
http://localhost:5080/api/v2/default/alerts \
-d '{"name":"erreurs_paiement","stream_type":"logs","stream_name":"commandes",
"is_real_time":false,"enabled":true,"owner":"root@example.com","folder_id":"default",
"description":"Au moins une erreur en une minute","row_template":"","context_attributes":{},
"query_condition":{"type":"sql","conditions":null,"promql":null,"promql_condition":null,
"aggregation":null,"vrl_function":null,"multi_time_range":null,
"sql":"SELECT count(*) AS nb FROM commandes WHERE level='"'"'error'"'"'"},
"trigger_condition":{"period":1,"threshold":1,"frequency":1,"cron":"","operator":">=",
"silence":0,"frequency_type":"minutes","timezone":null,"tolerance_in_seconds":null},
"destinations":["webhook_tp"]}'Scheduled or real-time #
| Type | Evaluation | Use |
|---|---|---|
| Scheduled | A SQL or PromQL query run at a regular interval | Thresholds and aggregates: error rate, percentile |
| Real-time | Evaluated at ingestion, event by event | A specific event to report immediately |
The local webhook pitfall #
Destination URL blocked by SSRF guardmessage? For security, OpenObserve refuses webhooks to a private address: neighbouring container, internal network, 127.0.0.1. Allow your targets precisely withZO_SSRF_ALLOWED_HOSTSorZO_SSRF_ALLOWED_CIDRS.ZO_SKIP_SSRF_CHECKS=truedisables the protection: keep it for a lab.
2. Pipelines #
Processing data before storing it.
Real-time and scheduled #
A pipeline chains a source, conditions, functions and one or more destinations. It is built graphically in the UI.
| Type | Source | Typical use |
|---|---|---|
| Real-time | A stream, at ingestion | Mask a field, enrich, route to another stream |
| Scheduled | A query run periodically | Produce a stream of aggregates, like a recording rule |
Best practice: filter and mask sensitive data in a real-time pipeline, before storage. A read-time filter removes nothing from disk.
My progress
Sign in to track your progress and take notes. Sign in
Recommended Articles
Grafana Alloy: Introduction and Architecture
Discover the fundamental concepts of Grafana Alloy, the transition from the static Agent to Alloy...
Data streams et templates Elasticsearch : component templates, index templates et séries temporelles
Gérer les données horodatées avec les data streams : index templates et component templates, conv...
Transformer avec VRL et tester ses pipelines Vector
Le langage VRL (Vector Remap Language) : analyse de logs (JSON, regex, syslog), gestion des erreu...
OpenTelemetry Collector, Grafana Alloy et Bindplane : comparer trois approches des pipelines de télémétrie
Comparatif détaillé de trois façons de gérer des pipelines de télémétrie : l'OpenTelemetry Collec...
Grafana Alloy: Understanding and exploiting the User Interface (UI)
Discover how to enable, secure, and use Grafana Alloy's built-in web interface to visualize your ...
Grafana Assistant: AI at the service of observability
Discover Grafana Assistant, the artificial intelligence integrated into Grafana Cloud. Learn how ...
Ingestion Elasticsearch : Bulk API, ingest pipelines, enrich et reindex
Ingérer et transformer des données dans Elasticsearch : Bulk API, ingest pipelines et processeurs...
Logs dans Datadog : collecte, pipelines, index et maîtrise du volume
Collecter les logs avec l'agent, les structurer avec pipelines et processeurs (grok), utiliser fa...
Bonnes pratiques Logstash : pipelines, performances, fiabilité et supervision
Bonnes pratiques Logstash : pipelines multiples, dissect plutôt que grok, conditionnels, persiste...